
SPY last week was rejected at channel resistance, coming up $0.63 short of surpassing the all-time high of $286.63 reached January 26. The path of least resistance is down. A covered put might help.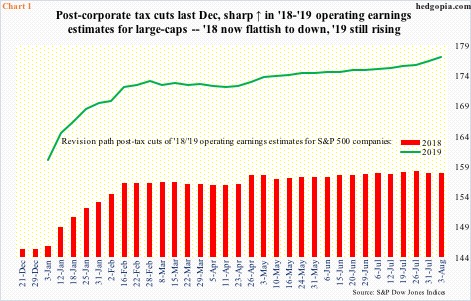
There are interesting dynamics at play in earnings estimates for US large-caps. Operating estimates for S&P 500 companies are sideways to slightly down for 2018 but still rising for next. As of last Friday, 2019 estimates were $177.13 – a new high – even as 2018 stood at $157.90, down $0.34 from a week ago. In fact, 2018 is essentially flat the past three months (Chart 1).
This phenomenon is also evident in mid- and small-caps. As of last Friday, 2019 operating earnings estimates for the S&P 400 rose to a new high $123.08. In contrast, 2018 peaked at $106.66 three months ago, with the latest consensus of $104.23. Similarly, 2019 estimates for the S&P 600 were $61.51 last Friday, versus $61.63 toward the end of June; for 2018, latest estimates were $48.07, a full $2.59 lower from the third week of March.
This is typical of how the sell-side normally works. More often than not, they start out a year strong and then gradually bring the estimates down as time passes. Estimates for both 2018 and 2019 took off as the Tax Cuts and Jobs Act of 2017 was signed into law on December 22 last year. Like clockwork, with five more months before the year even begins, 2019 estimates are still rising. The question is, how reliable are these estimates?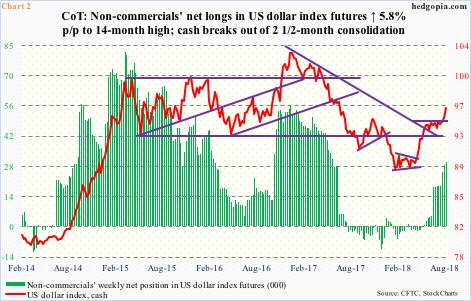
For large-caps in particular, one potential headwind is the US dollar. The US dollar index dropped 15.1 percent between early last year and February this year. It bottomed at 88.15 on February 16, then went sideways for a couple of months, followed by a rally into the end of May. Then, unable to take out 95-plus, it once again went sideways for 10 weeks. This changed last Friday when Turkey-inspired one-percent slide in the euro helped the US dollar index break out (Chart 2). The euro makes up 57.6 percent of the index. This is now an important level to watch.
Also worth watching is non-commercial futures traders’ reaction to Friday’s breakout in the cash. As of last Tuesday, they held 30,102 net longs, which have gradually risen over the last several weeks. As early as three months ago, they were net short. These traders tend to be trend followers. In the right circumstances, the green bars in Chart 2 can grow a lot taller. In the event the dollar continues to rally, a strong currency is not conducive to multinationals’ earnings.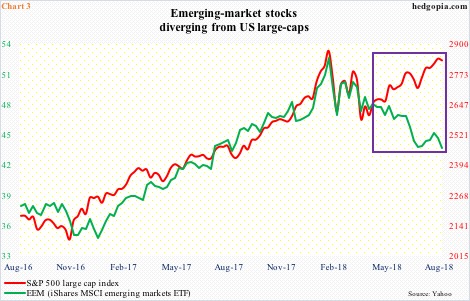
A strong dollar is already taking a toll on emerging markets. Chart 3 plots the S&P 500 large cap index against EEM (iShares MSCI emerging markets ETF). The two tend to move in unison. Not the past four months, though (box). Divergence between the two arose as the US dollar index began to rally mid-April. As things stand, one of the two is lying. A catch-up trade likely awaits the S&P 500.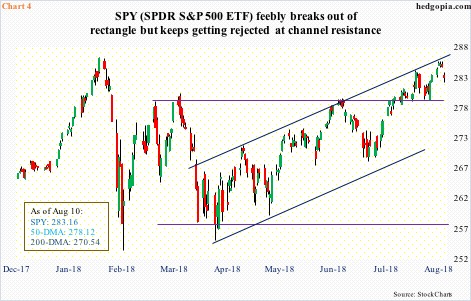
In the wake of the sell-off late January-early February this year, the S&P 500/SPY (SPDR S&P 500 ETF) essentially played ping pong in a rectangle, until they broke out mid-July. On SPY, the 280 breakout was followed by a successful retest (Chart 4). Despite this, the subsequent rally still came up $0.63 short of surpassing the all-time high of $286.63 reached January 26. Last week, SPY once again bumped into five-month channel resistance. The path of least resistance is down. If overbought weekly momentum indicators begin to exert control, we could be looking at decent downward pressure. For now, nearest support of course is $280, followed by the 50-day moving average at $278.12.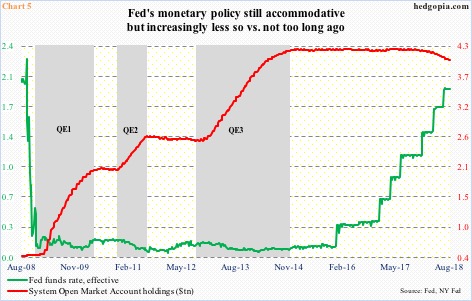
Speaking of which US monetary conditions are still accommodative, but increasingly less so than two or three years ago.
After keeping it suppressed at the zero bound for seven long years, the Fed began raising the fed funds rate in December 2015. Thus far, there have been seven 25-basis-point hikes, including one each in March and June this year (Chart 5). The FOMC dot plot forecasts two more hikes this year. In the futures market, September odds are at 96 percent, and December at 67 percent. If the Fed moves in both these meetings, the fed funds rate will be between 225 and 250 basis points – higher than prevailing inflation. In a leveraged economy, this can have implications for growth, and for 2019 earnings.
Concurrently, after three iterations of quantitative easing (QE), the Fed’s balance sheet ballooned. System Open Market Account (SOMA) holdings went from under $500 billion in November 2008 to $4.2 trillion in October 2014 when QE3 came to an end. In June 2017, the Fed began to reduce its portfolio of holdings. Last week, these assets were $4.03 trillion worth. Come October, the red line in Chart 5 can drop by as much as $50 billion/month. Once again, this is sizable enough to begin to matter to assets, including stocks.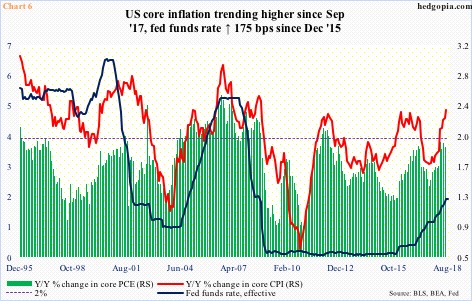
The Fed has a dual mandate – maximum employment and price stability. Since last September, consumer inflation has perked up, but nothing crazy. On an annual basis, core CPI in June rose 2.4 percent and core PCE 1.9 percent. The latter is the Fed’s favorite measure of consumer inflation. It has a two-percent goal. The last time core PCE grew with a two handle was in April 2012. FOMC doves focus on inflation.
The hawks on the other hand are focused on the unemployment rate, which in July fell to 3.9 percent, with May’s 3.8 percent the lowest since December 1969. Plus, with the economy in its 10th year of recovery and crucial sectors such as housing visibly slowing down, it may not be a bad idea to fill the monetary quiver with as many arrows as possible. If this mindset were to prevail within the FOMC, it does not take long before what is accommodative today becomes restrictive. This is more of a medium- to long-term risk. For now, the S&P 500/SPY can fall under its own weight – if nothing else just to unwind overbought technicals.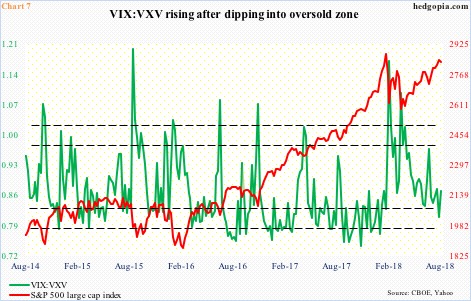
Even as SPY is giving out signs of fatigue, VIX (13.16) last Thursday fell to 10.17 intraday – the lowest since January 12 this year – before reversing with a hammer. A six-month downtrend line will be broken around 16. Plus, for three and a half months now, resistance at 19-plus has proven tough to crack. Immediately ahead, the 200-day lies at 14.45.
The case for a rally in VIX at least near term comes from Chart 7 as well. The VIX-to-VXV ratio closed out last week at 0.865, having dropped to 0.777 earlier on Wednesday – well into oversold territory. As the ratio rises, VIX, which measures 30-day volatility versus VXV’s 90-day, will begin to command higher premium than VXV. In this scenario, SPY ($283.16) comes under pressure. Right here and now, odds favor shorts. Hypothetically, weekly September 17th 280 put is selling at $0.64. A SPY short in combination with the short put raises the short price to $283.80.
Thanks for reading!
