
Last week’s excellent earnings results from five of the top six US companies were unable to lift equities, which had rallied big into the reporting season. With major equity indices extended on several timeframes, weakness could be brewing.
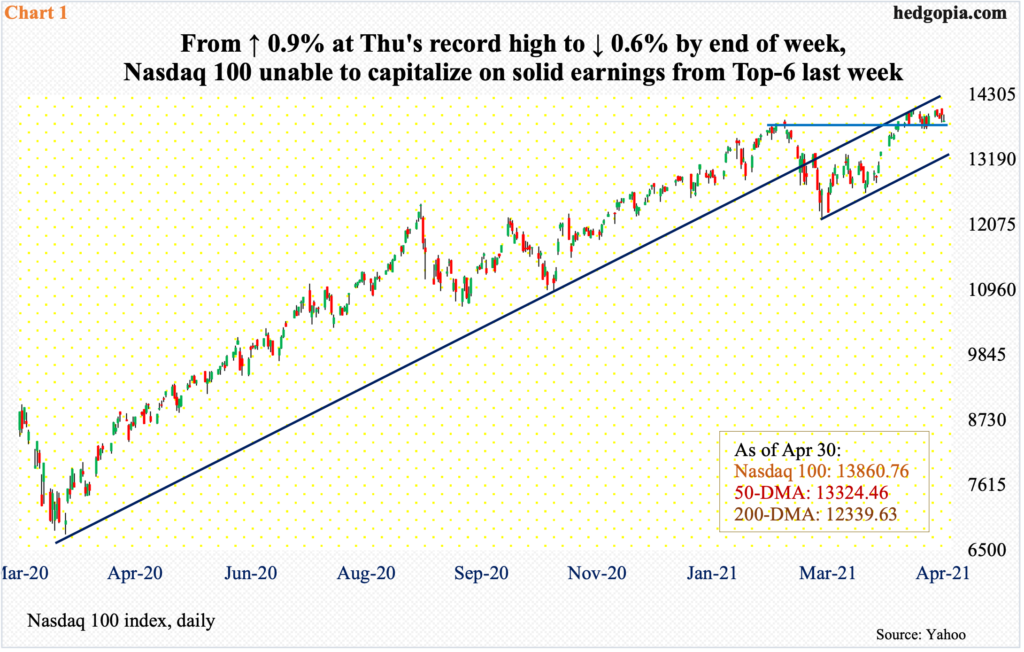
The Nasdaq 100 rallied 5.9 percent in April. All the action took place in the first week, with the remaining three essentially going sideways. In a volatile last week, it lost 0.6 percent.
In late February, the tech-heavy index (13860.76) lost a rising trend line from March last year, subsequently bottoming on March 5. The rally thereof crested last Thursday when the index ticked 14073.48. But tech bulls were unable to hang on to the gains in that session; the index gapped up 1.2 percent but only to see sellers take control in the very first few minutes. By noon, the index was down 0.5 percent to test its 20-day moving average, which held; the session ended up 0.5 percent – above both its 10- and 20-day. Come Friday, the index lost 0.8 percent to close right on the 20-day, with rising risks of a potentially bearish 10/20 cross-down.
The 20-day also approximates short-term horizontal support at 13840s. The 50-day lies at 13324.46, which is where a short-term rising trend line extends to (Chart 1).
The rather lackluster performance of last week unfolded in a week in which the top six US companies – all tech – reported their March quarter.
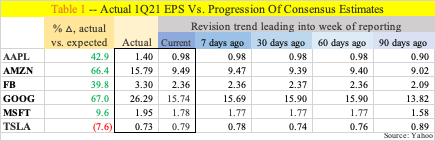
Five of the six – Apple (AAPL), Microsoft (MSFT), Amazon (AMZN), Google owner Alphabet (GOOG) and Facebook (FB) exceeded estimates, while Tesla (TSLA) slightly came up short. A few of them really hit it out of the park, with the delta between what was earned and what was expected very wide (Table 1). GOOG, for instance, was expected to bring in $15.74 and ended up posting $26.29. AMZN similarly earned $15.79 versus expectations of $9.49.
Of the six, AMZN, GOOG and FB ended the week up, AAPL, MSFT and TSLA down. Most noticeably, Thursday’s reaction on the Nasdaq 100 followed results from AAPL and FB on Wednesday. Even in the three that enjoyed an up week, reaction immediately after earnings was far from decisively bullish, with FB forming a hanging man on Thursday, GOOG a shooting star on Wednesday, while AMZN reversed lower 0.1 percent on Friday after tagging a new intraday high.
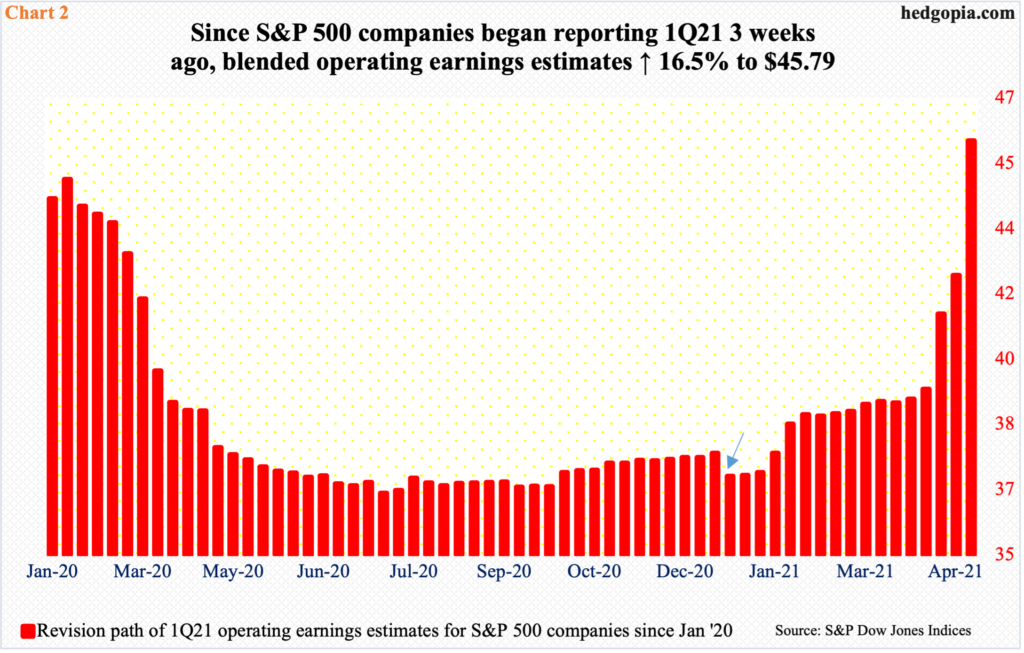
As a matter of fact, last week’s results from these six went a long way in significantly revising the blended estimates for 1Q21 higher. With nearly 71 percent of the results in, operating earnings estimates for S&P 500 companies through last Thursday rose $3.51 week-over-week to $45.79.
When the quarter began, these companies were expected to earn $37.04 (arrow in Chart 2), so the performance so far has been nothing short of impressive. This has helped push up estimates for the whole year. When the earnings season began in earnest three weeks ago, the sell-side expected $173.71; as of last Thursday, this has been revised higher to $183.53. Similarly, 2022 estimates have gone from $200.96 to $206.14.
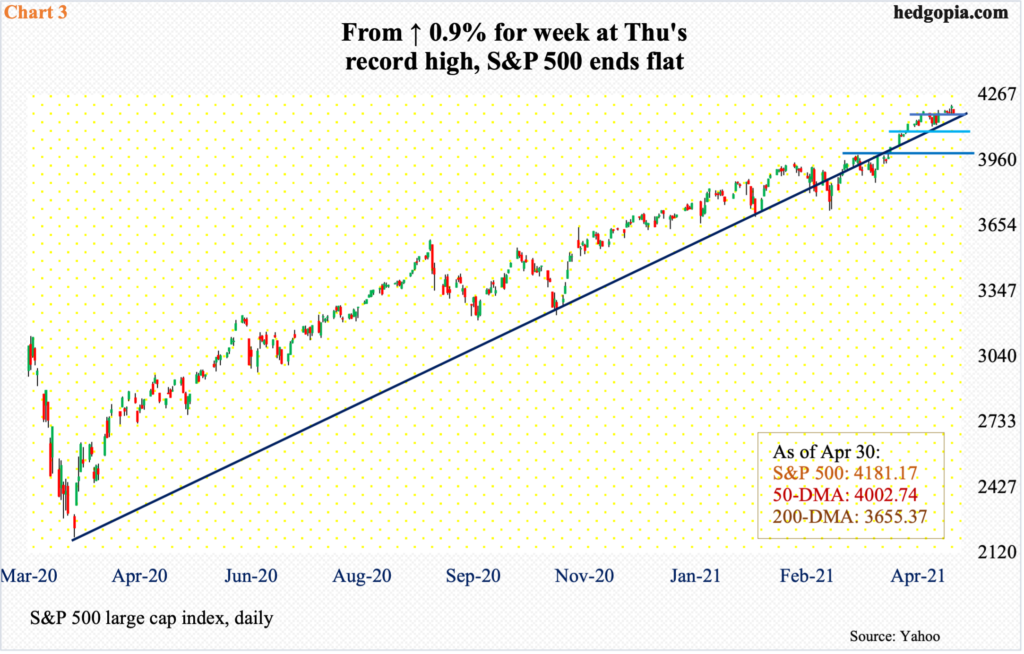
This has not had a desired effect on stocks. They did move up hugely into the earnings season. In the first quarter alone, the S&P 500 rallied 5.8 percent. In April, the large cap index added another 5.2 percent, but most of it was gained in the first half.
Last Thursday, the index (4181.17) posted a new intraday high of 4218.78 but, as was the case with the Nasdaq 100, bulls’ mettle was tested in that session; the S&P 500 gapped up 0.9 percent but sellers showed up in the very first minutes. By noon, it was down 0.2 percent, but bids showed up at the 10-day, with the session ending higher with a daily hanging man.
From up 0.9 percent at Thursday’s high, the S&P 500 ended flat last week. A weekly gravestone doji formed. This comes after prior week’s dragonfly doji.
The message is, sellers are beginning to come out of the woodwork.
The index ended last Friday right on short-term support at 4170s. A likely breach exposes it to a test of 4080s, and 3980s after that (Chart 3). Should things evolve this way, a rising trend line from the low of March last year will have been breached.
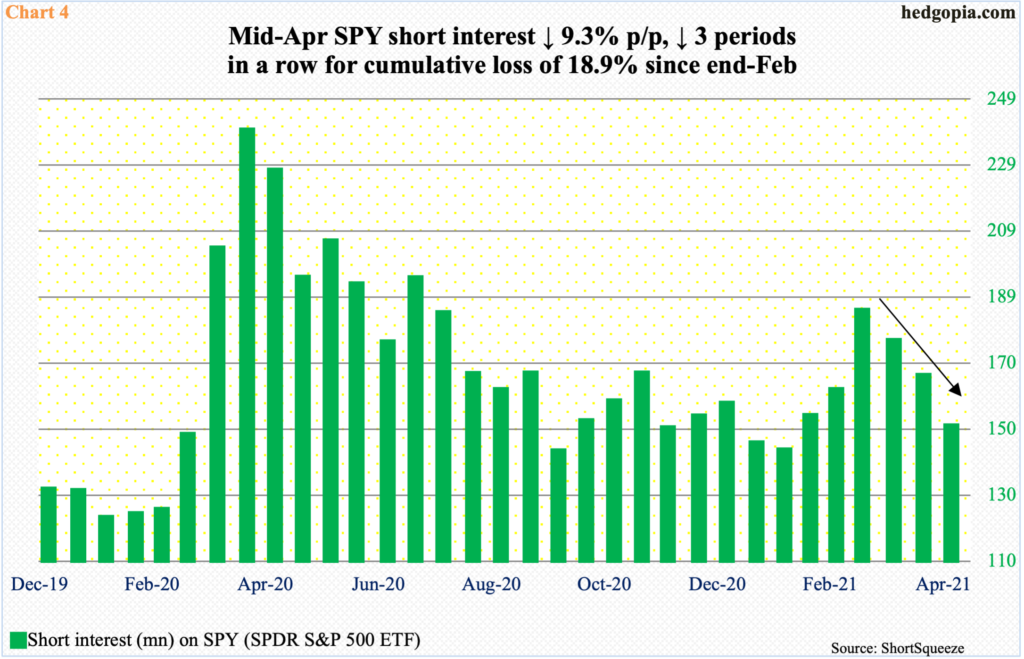
Bulls lack support from elevated short interest.
At the end of February, short interest on SPY (SPDR S&P 500 ETF) rose to eight-month-high 184 million shares. After slight downward pressure, the S&P 500 bottomed on March 4 at 3720s. SPY shorts covered. Short interest dropped in the next three periods – down 18.5 percent cumulatively from the end-February high. Mid-April, short interest stood at 149.2 million – a three-month low (Chart 4).
Time and again, zealous shorts have ended up helping the longs as they cover – or are forced to cover. We saw this unfold in March and April. This potential tailwind is not as potent currently.
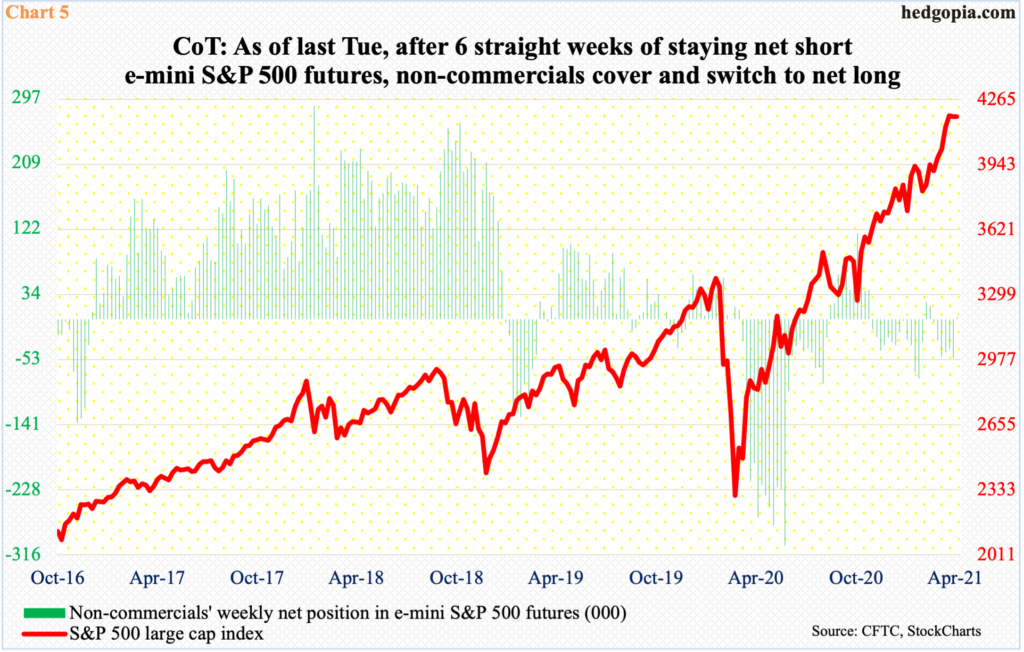
Similar dynamics are in play in the futures market.
In the week to last Tuesday, non-commercials switched to net long 2,284 contracts in e-mini S&P 500 futures. In the week before that, they were net short 52,161 contracts, for a delta of 54,445.
In fact, except for a couple of weeks in the first half of March, these traders had been net short since the last week of November last year (Chart 5). The S&P 500 has been nothing but up since that time. For a bull, there is probably nothing more fulfilling than a short squeeze. With non-commercials now net long, this cannot happen.
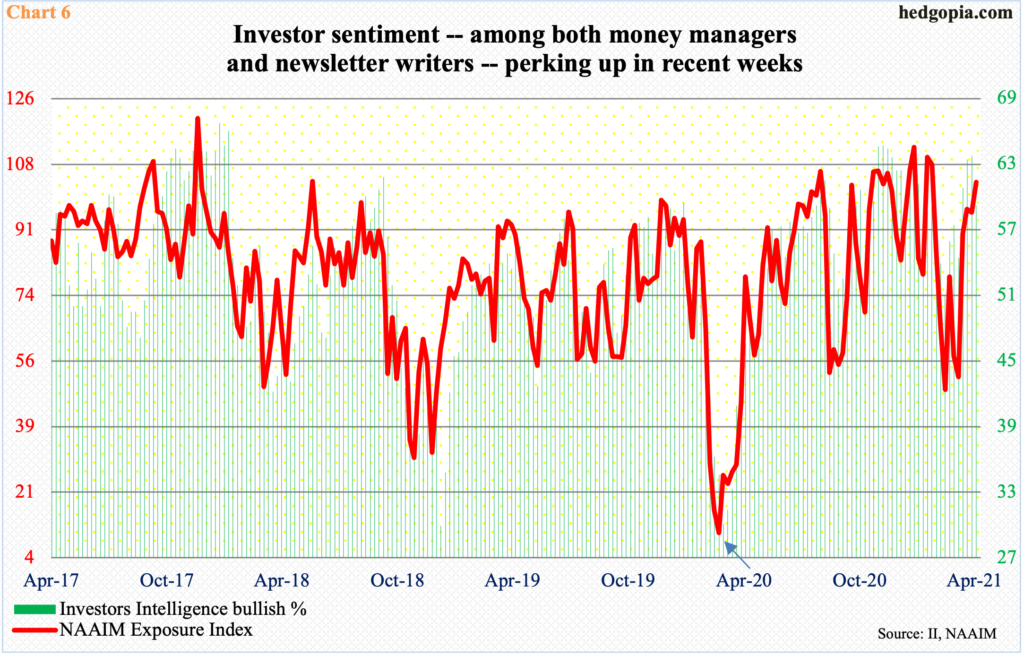
April’s rally also unfolded as investor sentiment bottomed at the end of March.
The NAAIM Exposure Index, which measures National Association of Active Investment Managers members’ average exposure to US equities, declined to 52.02 in the week to March 31. Earlier in February, it was north of 100 in two successive weeks. After the March bottom, sentiment progressively improved to last week’s 103.7. Readings above 100 are rare. Going back to July – that is, 774 weeks – there have been 30 100-plus readings, of which 14 were recorded since last August.
Apart from these professional managers’ bullish bent, newsletter writers too got more bullish early April. Investors Intelligence’s bullish percent stood at 54.4 percent in the week to March 30. In the next three weeks, sentiment surpassed 60 percent, with 63.7 percent in the week to April 20 matching the high of January this year. Last week, sentiment dropped to 59.2 but remains elevated (Chart 6).
Already-rosy sentiment can always get rosier, but odds are increasingly stacked up against that – particularly considering last week’s reaction to earnings results from the top six.
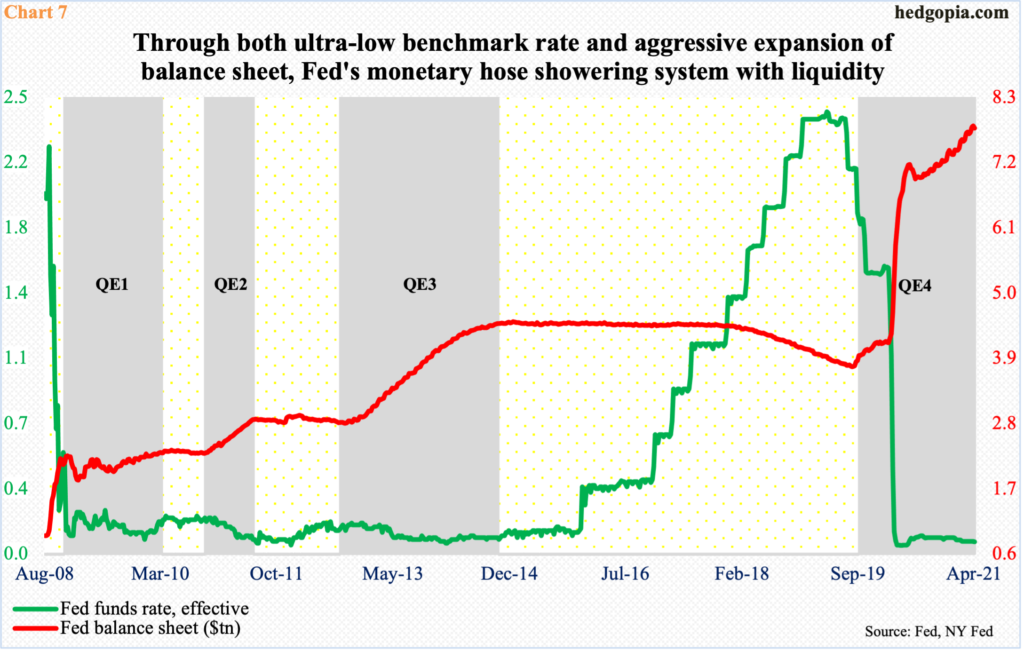
Last week was also a week in which the first estimate of 1Q21 GDP was published. Real GDP grew at an annual rate of 6.4 percent, and the Fed continued to promise easy money. At the end of last week’s FOMC meeting, Chair Jerome Powell said risks to the economic outlook remain. “It is not yet time to have a conversation about tapering,” he said.
The fed funds rate remains zero-bound, in a range of zero to 25 basis points, even as the Fed purchases at least $80 billion of treasury notes and bonds and $40 billion of mortgage-backed securities every month. Its balance sheet is now $7.8 trillion strong, up from $4.2 trillion early March last year (Chart 7).
There is plenty of liquidity in the system. Powell promised last week this would continue. The risk is markets may be growing numb to the idea of continued stimulus. We can at least put last week in that category.
As things stand, risks are to the downside for equities. It remains to be seen how far the bears can take it. Conditions remain overbought on nearly all timeframes. Tech in particular looks vulnerable.
Thanks for reading!
