
U.S. Treasury yields have come under upward pressure for nearly a month and a half, although the increase has not been uniform across the curve.
The yield curve (spread between the two- and 10-year) last Friday was only 79 basis points, up from a 10-year low 75 basis points a day earlier.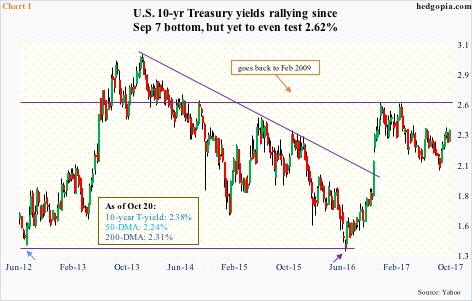
Two-year yields, which tend to be sensitive to expectations for the Fed’s monetary policy, have shot up from 1.27 percent on September 7 to a nine-year-high 1.60 percent, and the 10-year from 2.03 percent to 2.38 percent – hence an essentially flat curve.
Side note: Banks in general borrow short and lend long, and tend to respond positively to a wider curve, which is not the case now. XLF (SPDR financial sector ETF) nonetheless has broken out, having also bottomed on September 7.
The inability of 10-year yields to aggressively follow along the two-year is telling, particularly because several economic data points have firmed up of late. The ISM manufacturing index in September, for instance, rose two points month-over-month to 60.8, which was the highest since 61.4 in May 2004.
In fact, 10-year yields have not even tested 2.62 percent. The last time the eight-plus-year resistance was tested was March this year, and before that December last year (Chart 1).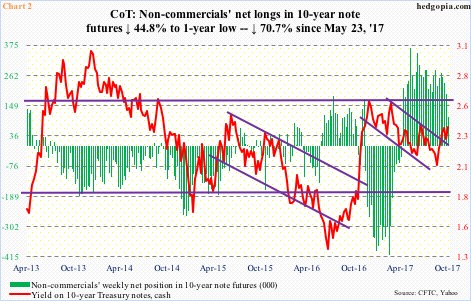
This is particularly of note as non-commercials in recent months have been a source of tailwind to 10-year yields.
As of May 23 this year, these traders were net long 362,501 contracts in 10-year note futures. This was the highest since December 2007. As of last Tuesday, they only held 106,291 contracts (Chart 2).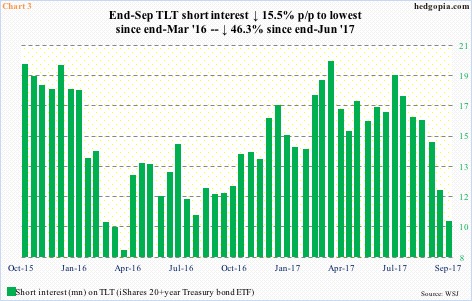
The tailwind from non-commercials has an offset elsewhere, magnitude notwithstanding.
Short interest on TLT (iShares 20+year Treasury bond ETF) stood at 18.6 million at the end of June this year. In the next three months, this was cut down to 10 million, which was the lowest since the end of March last year (Chart 2). Bond prices and yields have an inverse relationship. Thus, TLT squeeze probably acted as a headwind to 10-year yields.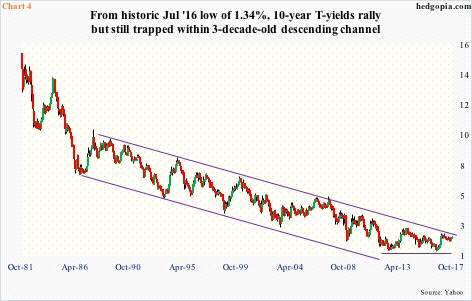
Assuming 10-year notes got caught in these two opposing forces of supply and demand, it is too soon to declare if the recent backup in yields is the sole result of fundamentally driven factors.
Yes, in a large scheme of things, July last year may prove to be historic when the 10-year bottomed at 1.34 percent (violet arrow in Chart 1), successfully testing the low of four years ago. But for rates to continue to head higher, selling needs to be genuine. Once again, yields are still below 2.62 percent, and this level has taken on added significance.
Ten-year yields have traded within a descending channel for three decades now (Chart 4). In a channel, with the passage of time, the breakout point consistently drops. As things stand, this will happen around 2.62 percent.
Until then, it is all noise.
Thanks for reading!
