Last week, bond bulls wasted a big opportunity. Sort of. Intraday Friday, 10-year Treasury yields broke down, but only to recover big by close.
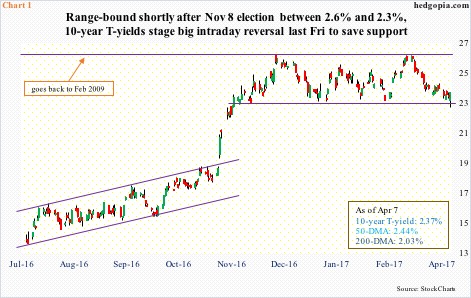
On December 15 last year, yields hit 2.62 percent before retreating. This resistance goes back to February 2009, and was tested again on March 13 – again unsuccessfully. (The Fed hiked on March 15 this year and December 14 last year – a third 25-basis-point hike since December 16, 2015.)
While bond bulls were defending 2.62 percent, bears were hammering out support at 2.31 percent. Hence range-bound 10-year yields (Chart 1). Last Friday, they fell to 2.27 percent intraday before rallying back into the range.
A loss of this support could potentially reverberate through a whole host of assets. Arguably, this could have occurred last week.
Besides Thursday’s Syria airstrikes – and the resulting bidding for safe-haven Treasury bonds – Friday also brought the disappointing jobs report for March.
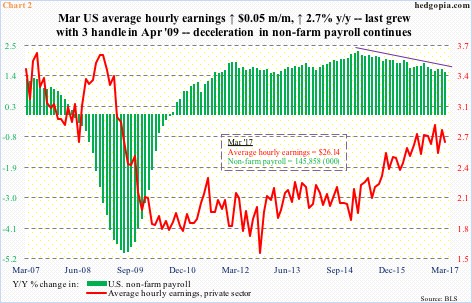
Non-farm payroll grew by much-weaker-than-consensus 98,000 in March. This came on the heels of downwardly revised 219,000 in February and 216,000 in January. It is always possible the March print is an aberration, but the trend decidedly has been decelerating (Chart 2).
The monthly average addition of jobs so far this year is 178,000. This compares with 187,000 in all of 2016, 226,000 in 2015 and 250,000 in 2014.
Wage growth continues to remain subdued. The last time average hourly earnings of private-sector employees grew year-over-year with a three handle was in April 2009. The 2.85 percent growth last December came closest – has been under pressure since.
If the initial breakdown in yields last Friday held, we would probably see a squeeze this week.
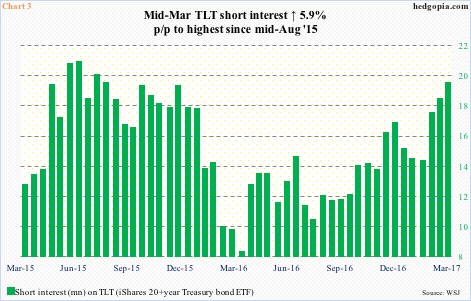
Short interest on TLT, the iShares 20+year Treasury bond ETF, stood at 19.4 million mid-March (Chart 3). (End-March numbers will be published tomorrow.)
Short interest has been rising since mid-April last year, and most recently since mid-February this year. The mid-March total was the highest since mid-August 2015. In the right circumstances, this is a potential recipe for a squeeze.
But TLT bulls ran out of steam last week.
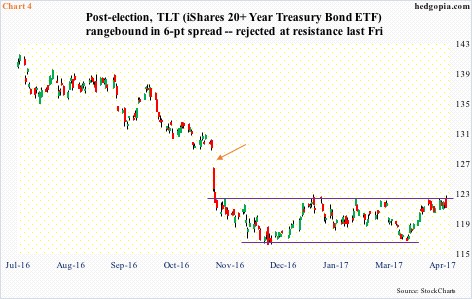
From low to high, the ETF (120.71) rallied five-plus percent in the past four weeks.
Shortly after post-election gap-down (arrow in Chart 4), TLT bottomed just under 116. In the meantime, resistance proved tough just south of 122. It is caught in a six-point range. In the event of a convincing breakout, using a measured-move-target approach, the ETF can be expected to rally to just about fill the gap. (The 200-day moving average rests at 126.85.)
At least near term, odds are beginning to get stacked against this. The reversal last Friday is telling.
It is worth recalling that just five weeks ago non-commercials were massively net short 10-year-note futures. They were positioned for a breakout in yields. Things did not quite pan out the way they expected. The 2.6-percent held firm (Chart 1). Then they began to cover. In five weeks, holdings went from 409,659 contracts to 55,766 (Chart 5). This is when yields went from top of the range to the bottom, and TLT from bottom of the range to the top. This tailwind (TLT) is now pretty much spent.
Plus, daily conditions are overbought on TLT. Barring escalation of tension in Syria and/or N. Korea, the ETF is itching to go lower – at least near term. If nothing else just to unwind overbought conditions. It is too soon to say if it is headed all the way to the bottom of the range – and yields toward the top of the range.
On TLT, support at the 50-day lies at 119.50, even as yields face resistance at 2.44 percent, where its 50-day lies. A takeout of this resistance likely ensures – once again – of a test of 2.6 percent.
All this probably creates opportunities for options traders through directional bets such as a TLT bear call spread, or non-directional bets such as an iron condor (credit is received in both). The latter combines a bear call spread with a bull put spread.
Thanks for reading!

