
Arguably, if U.S. stocks followed crude oil or economic data, they probably would be a lot lower.
Operating earnings of S&P 500 companies peaked at $29.60 in 3Q14, and have been decelerating since. With 474 companies having reported 4Q15 (as of February 25th), estimates keep dropping –now at $23.49. When 4Q15 started, they were $30.42. With this, 2015 estimates have now dropped to $100.88, down from a forecast of $137.50 at the end of 2Q14.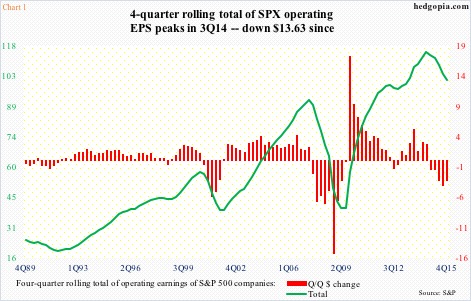
Chart 1 presents four-quarter rolling average of operating earnings of S&P 500 companies, which peaked at $114.51 in 3Q14. Since then, they have dropped for five straight quarters. Momentum is gone. In fact, it is in reverse.
If we look at 2016 and 2017 estimates, sure the usual optimism is there, but even here the trend is down, with 2016 now at $119.17 (versus $137.50 a year ago) and 2017 at $137.51 (versus $141.11 six weeks ago).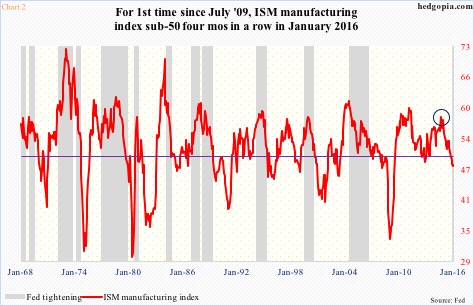
Earnings have followed manufacturing lower – more or less. Most recently, the ISM manufacturing index peaked in August 2014 at 58.1 (circle in Chart 2). By this January, it was down nearly 10 points (48.2). Last October, it fell below 50, and has remained there since.
This was the first time since July 2009 that the manufacturing index has remained sub-50 for four straight months. The new orders index rose 2.7 percentage points to 51.5 in January, but has been sub-50 in three out of last five months (not shown in the chart).
(Side note: It is rare for the Fed to begin tightening with the manufacturing index below 50. Yet, for the first time in nine years, rates went up mid-December last year.)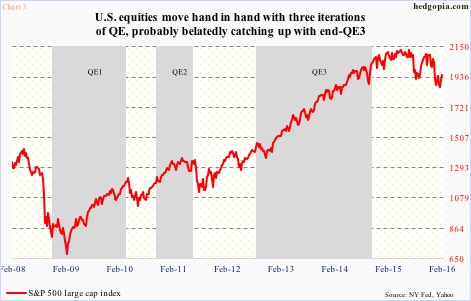
Yet, stocks are marching to the beat of a different drum.
Back when the Fed was aggressively expanding its balance sheet, U.S. stocks simply followed QE.
Chart 3 plots the S&P 500 index with three iterations of QE. During QE 1/2, the index rose, and dropped as soon as QE ended. This was again the case during QE3, except the index did not immediately crater as QE ended. It went sideways for a while, followed by two sizable drops – one in August-September last year and the other in January this year. A major peak has likely formed. Yet, 1800 – major support – has so far been defended.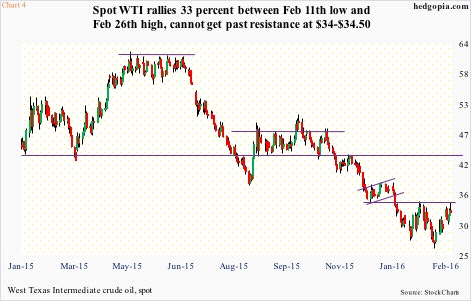
Right at this moment, stocks seem to be following crude oil and gold – the former in particular. The correlation with oil is positive, while with gold it is negative.
The irony is that both oil and gold seem to want to go lower in the near term.
Last Friday, spot West Texas Intermediate crude produced a shooting star (although it did not gap up on the open) on a daily chart. This candlestick can mark a potential trend reversal, but needs confirmation before action (followed by either a gap down or a long red candle).
Intra-day since the February 11th low, the WTI rallied 33 percent in two weeks (Chart 4), propelled by hopes of a mega deal to cut production. In the week before last, OPEC bigwig Saudi Arabia along with fellow members Qatar and Venezuela agreed with non-OPEC Russia to freeze output at January levels. But Iran is not going along.
The oil market is already oversupplied by an estimated one million to two million barrels a day. Last week, S. Arabia ruled out production cuts. That nation, a Sunni, probably views this as an opportunity to hurt Iran, a Shia, and Russia, which has close ties with Iran ally Syria, as well as U.S. shale. Odds are a breakthrough in production cut is not forthcoming. In this scenario, oil retreats, and resistance holds.
Where did that shooting star show up on Friday? At $34-34.50, which in the last six weeks has repelled the WTI’s rally attempts six times. With daily momentum indicators overbought, the spot closed Friday right above the 50-day moving average ($32.60), which it likely loses this week. Incidentally, for whatever it is worth, if the crude breaks out of its W formation, technicians would be looking at $42-$42.50.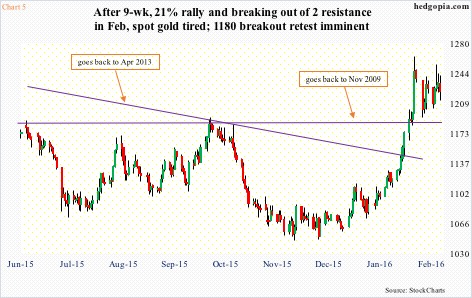
Spot gold, on the other hand, just recently managed to break out. Early this month, it first pushed through a declining trend line going back to April 2013 at $1140-ish, followed by a break through six-plus-year horizontal resistance at $1180 (Chart 5). The breakout has the potential to be a major one. Near-term, though, a breakout retest looks imminent.
First of all, money continues to flow into gold ETFs. In the week ended last Wednesday, GLD, the SPDR Gold ETF, pulled in another $1.9 billion (courtesy of ETF.com). Plus, less than $5 separate from completing a potentially bullish golden cross (daily).
That said, the metal increasingly is sending out signs of fatigue near- to intermediate-term. Off its December 3rd low ($1045.4) through February 11th high ($1263.9), spot gold rallied nearly 21 percent. Since that high, it has essentially gone sideways.
For the past nine sessions, gold has traded around its 10-day moving average, which is now pointing lower. Daily MACD just completed a bearish crossover. And this week produced a long-legged doji/spinning top, after a hanging man in the prior week. The metal is itching to go lower near-term.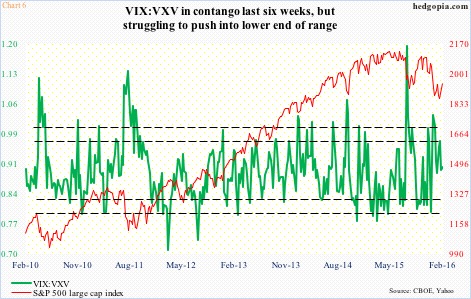
Stocks’ near-term fate is likely decided depending on if they decide to follow oil or gold, based on which the ratio of VIX to VXV will either continue lower or turn back up.
The green line in Chart 6 – 0.91 as of last Friday – has plenty of room to go lower toward low 80s/high 70s, which, by the way, has not happened the past couple of months. A continued push lower evidently means stocks continue to rally. A reverse is true if the ratio turns back up.
A look at the chart of spot VIX gives us some clues as to which way VIX:VXV might be headed near-term.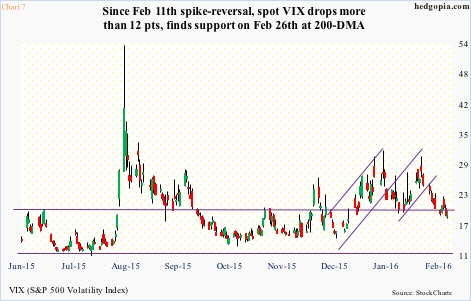
Since January 15th, VIX spiked above 30 three times, only to reverse lower hard. The latest such reversal took place on February 11th, when stocks bottomed. Since that high through last Friday’s intra-day low, it gave back north of 12 points. That low was within spitting distance of its 200-day moving average. VIX has not traded below that average since December 29th. It is still below resistance at 20 (Chart 7), but, with overbought on a daily basis, odds are decent VIX rallies from here.
In this scenario, stocks weaken. Unless, of course, flows improve substantially.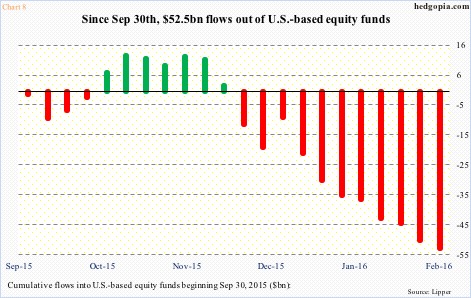
The trend so far is anything but. In the week ended last Wednesday, another $2.8 billion came out of U.S.-based equity funds (courtesy of Lipper). Since the year began, nearly $44 billion has left. This despite the fact that the index is now only down 4.7 percent for the year. At one point, it was down north of 11 percent. Longs are using strength to exit.
Since September 30th last year, which approximates a low in the S&P 500 index before rallying 13 percent in five weeks – hence a good reference point – north of $52 billion has left equity funds (Chart 8).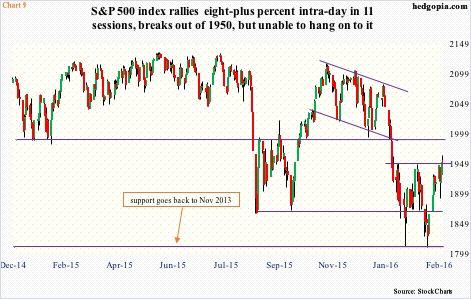
Not what equity bulls would like to see when the S&P 500 (1948.05) was on the verge of an important breakout. In fact, last Thursday, it did break out of resistance at 1950. Since January 13th, the index already tried three times to push through that level. Thursday was the fourth, and it was a success. Well, maybe not.
Come Friday, it slipped back below 1950 (Chart 9), though it is still above its 50-day moving average. Daily technicals are grossly overbought, and with spot VIX seemingly wanting to go higher, the path of least resistance for stocks is down. Hand in hand with crude oil, which seems headed the same way.
Thanks for reading!
