
VIX just rallied to a seven-month high. At the same time, it struggled to hang on to the gains in the past couple of sessions. The recent surge has pushed it into overbought territory, which could very well be in the process of unwinding. This should help stocks near term.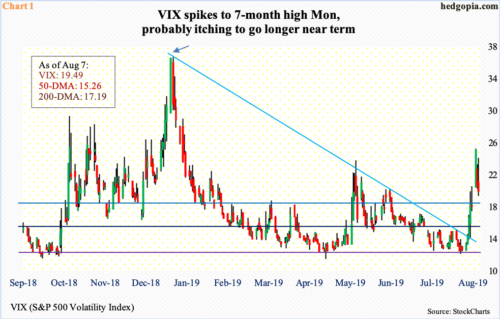
There are more signs volatility is itching to go lower near term.
Monday, VIX shot up to 24.81 intraday. That was the highest since early January this year. Back then, VIX was on its way down after peaking around Christmas (arrow in Chart 1). On Boxing Day, VIX reversed hard after tagging 36.20 intraday.
Between early October and late December last year, the S&P 500 large cap index (2883.98) dropped just north of 20 percent. This time around, after peaking on July 26 at 3027.98 through Monday’s low, it shed 6.8 percent. On the weekly, more pain probably lies ahead. On the daily, however, relief is likely. A reduction in volatility will help.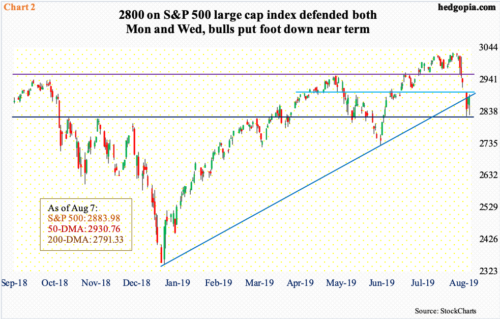
Going back to March last year, just north of 2800 has proven to be an important price point (Chart 2). Monday, the S&P 500 made an intraday low of 2822.12 before attracting bids. This support was defended again Wednesday, when intraday the index was down 1.9 percent but ended the session up 0.1 percent. With two sessions to go this week, the weekly has produced a potentially bullish hammer candle.
Monday, the S&P 500 breached a rising trend line from December, but not much damage ensued as bulls stepped up in defense of 2800. Both Tuesday and Wednesday, the index essentially closed on that trend line. Right above lies gap-down – as well as horizontal – resistance at 2900. After that comes the 50-day at 2930.76, followed by 2950-60s. Bears will obviously try to defend these levels as they have smelt blood in the recent sell-off. They will be keenly watching how volatility behaves in the sessions ahead.
VIX is comfortably above both 50- and 200-day moving averages (15.26 and 17.19, respectively). These averages approximate horizontal support at 15 and 17-18 (Chart 1).
That said, both Tuesday and Wednesday, VIX was unable to hang on to the intraday gains. Wednesday, it spiked to 23.67 before closing at 19.49. The VIX-to-VXV ratio ended the session at an elevated one. As a matter of fact, Monday the ratio closed at 1.12, which is what Chart 3 shows. This is very extended, and if past is prologue, unwinding follows sooner than later.
VIX measures 30-day forward volatility using S&P 500 options. VXV does the same, except it goes out to three months. When stocks are rallying, premium tends to come out faster from shorter-term volatility, in this case VIX. When stocks come under pressure, VIX gets bid up more than VXV, hence the rise in the ratio. As it drops, stocks get a tailwind.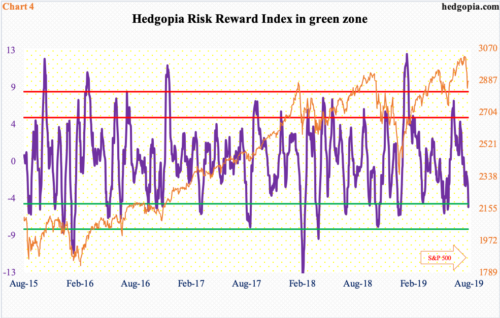
The recent sell-off in stocks pushed several daily momentum indicators into oversold territory. This in and of itself does not mean unwinding has to begin right away. An oversold market can stay that way longer than we can imagine. But the longer things stay oversold – or overbought, for that matter – the higher the odds of a reversal, if nothing else just to unwind the conditions.
For whatever it is worth, our own Hedgopia Risk Reward Index just entered the green zone (Chart 4). Several times in the past, it has misfired or continued lower after entering this zone, but once in this territory, reversal odds grow.
Thanks for reading!
