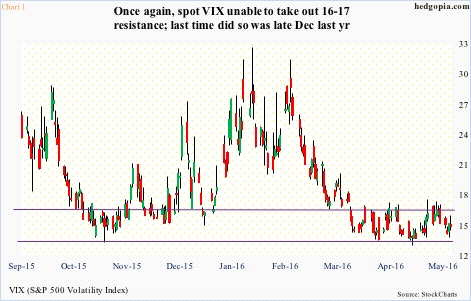
In all five sessions last week, spot VIX got rejected at 16.50, which at the time also approximated the upper Bollinger Band. This is not any plain-vanilla resistance. It goes back two decades.
More often than not, once VIX convincingly gets over 16-17, it has shown a tendency to rally. Chart 1 only shows a few such instances. The last time VIX rallied past this level was in late December last year, just before the January swoon in stocks.
For nearly two months now, VIX has been hammering at that resistance from below, but to no avail. The good thing, for volatility bulls, is that the low end of the range it is in has not given way. Range-bound action continues. The longer this goes on, the higher the odds of a sustained move higher.
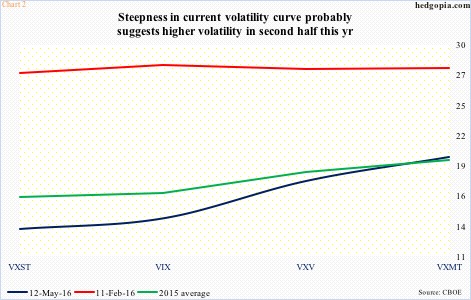
The VXST-VIX-VXV-VXMT curve is probably telling us exactly that.
First, a brief primer on the four. VIX measures the implied volatility of S&P 500 index options over the next 30-day period. The other three measures of volatility achieve the same goal, but for different time periods – VXST for nine days, VXV for three months, and VXMT for six months.
Chart 2 lays out the VXST-VIX-VXV-VXMT curve for three different time periods – May 12th (2016), February 11th (2016), and 2015 (average).
The dark blue and green lines in Chart 2 are in contango, while the red line is in backwardation. The latter developed when the S&P 500 bottomed after the January collapse in stocks; shorter-term volatility was in high demand back then. As a matter of fact, intra-day, VIX peaked at 30.90 on February 11th (Chart 1). The backwardation look of the red line makes sense.
Since February 11th, the whole curve has shifted lower… once again, it makes sense. Shorter-term volatility measures – VXST and VIX – have taken it on the chin. As have VXV and VXMT, but with a twist. The longer end of the curve has steepened – much more than the 2015 average. The steepness in the curve probably suggests markets are bracing for higher volatility in the second half of the year.
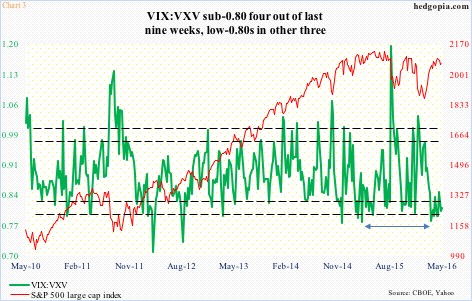
In this scenario, there is a lot of unwinding left to be done. The VIX-to-VXV ratio has languished in oversold territory in the past nine weeks, with four sub-0.80 readings, and three in low-0.80s. The 0.782 reading on March 18th was a one-year low (Chart 3).
Once the ratio gets going, there is a lot of distance to cover before it reaches overbought territory. That will be the time spot VIX probably breaks out of 16-17. The steepness in the dark blue line in Chart 2 is hinting at that.
Thanks for reading!

