
Do non-commercials have it right? Their net shorts in Russell 2000 futures peaked at 46,064 contracts on August 18, a week before stocks, including small-caps, bottomed. Since then, they have gradually been reducing their bearish bias, with holdings at -27,708 by Tuesday last week (Chart 1). They cut back last week even as the Russell 2000 was coming under renewed pressure.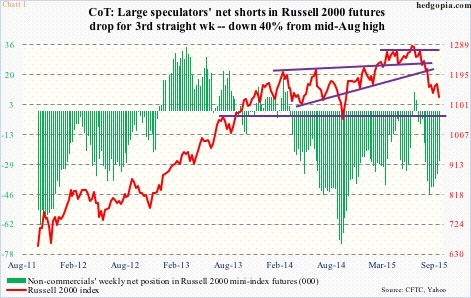
After the August 24th low, IWM, the iShares Russell 2000 ETF, quickly tacked on just shy of 10 percent into the September 16th-17th FOMC meeting, and reversed ugly once the statement came out. The subsequent sell-off took out the August low, albeit only slightly (Chart 2). Of the four major U.S. indices, the Russell 2000 was the only one to have undercut the August low. Those lows are intact on the S&P 500 index, the Dow Industrials, and the Nasdaq composite.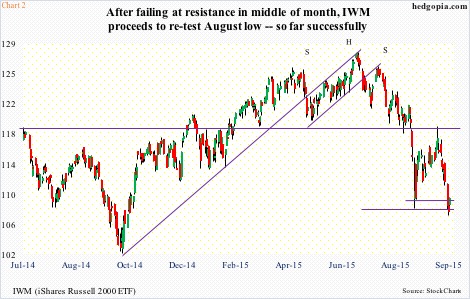
So where to from here?
As things stand now, it is hard to get all excited by small-caps. With that said, the near-term picture is improving.
Bulls would probably try to go after shorts who have been gradually adding to short interest particularly the past couple of months. It has gone from 109.1 million shares to 129.6 million (Chart 3). Be that as it may, shorts have not been as aggressive as they were last October. Mid-October, short interest stood at 155.3 million. And we know what followed back then. Stocks bottomed in the middle of that month, and went on to post new highs, small-caps included.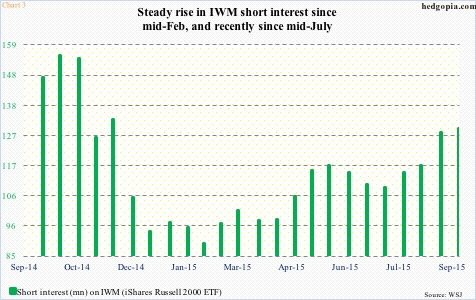
This is not to suggest that a rally of similar magnitude and duration awaits us. Seasonality favors stocks. 3Q earnings season is about to get underway, where the bar is low. These are all positives. The biggest handicap right now is what transpired in August. Stocks got shellacked, inflicting technical damage. The afore-mentioned four indices, plus others, all took a hit, and remain bruised technically.
Staying with IWM ($109.20), going back to March last year, $118-$119 has proven to be an important price range, which the ETF sliced through during the August sell-off. The August 24th-September 17th rally stopped right at that level. The September 17th intra-day high of $118.55 at the time also approximated the 50-day moving average, which now is two points lower.
The bottom line? It is hard to get all bulled up on IWM. But here is the thing. During the recent sell-off, even though the ETF’s price went on to undercut the August low, several momentum indicators remained on course to scoring higher lows. Encouraging – at least near-term. IWM needed to get over $109-and-change for meaningful improvement in the near-term picture. Yesterday, it closed right on it. Given daily oversold conditions, odds favor it will be able to build on yesterday’s action.
Put it all together, and options – once again – are probably the best way to play this.
Hypothetically, October 9th weekly 108 puts fetch $1.26. These are obviously out of the money, and will be put should IWM drop at least 1.1 percent in the next seven sessions, in which case it is an effective long at $106.74. Should the recent lows be violated, there is another layer of support around $106.50.
Thanks for reading!
