
Following futures positions of non-commercials are as of April 23, 2024.
10-year note: Currently net short 353.9k, down 8.1k.
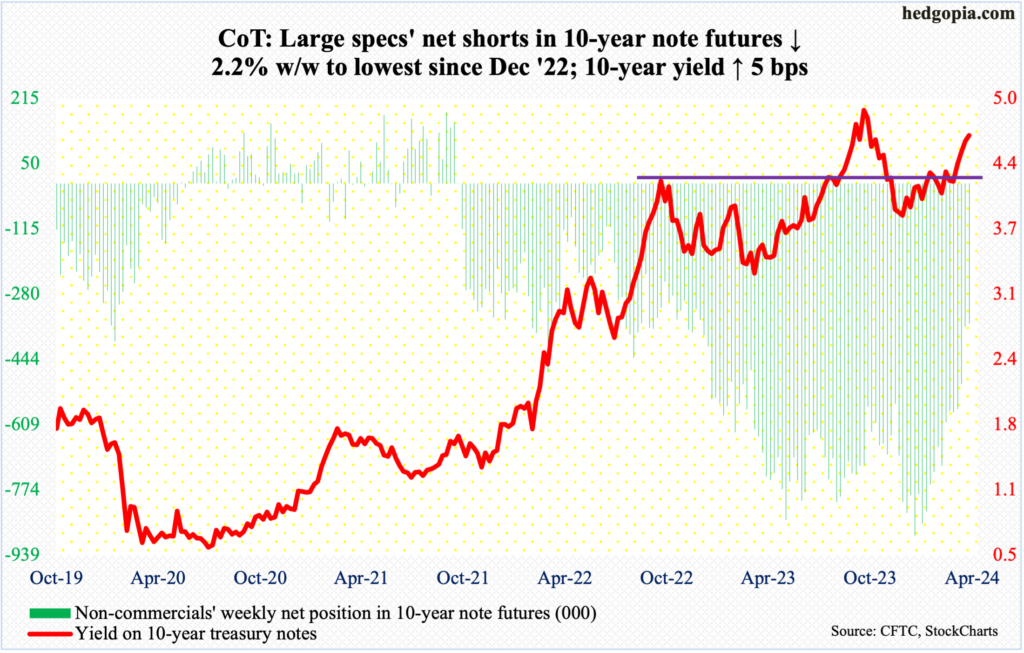
The FOMC meets next week. This is the year’s third scheduled meeting and five more remain after this. The two-day meeting ends on Wednesday and will be followed by Chairman Jerome Powell’s presser. Markets will be on pins and needles until then.
Ever since his dovish pivot on December 12th, Powell has sounded like someone with an itchy finger to ease. In response, at one time in January, markets were pricing in as many as seven 25-basis-point cuts this year. The data – both inflation and growth – persistently refused to cooperate.
In the meantime, even until the March meeting, FOMC members expected three cuts this year. The economy, on the other hand, has continued to surprise on the upside, leading several FOMC members to alter their rates outlook, with some even stating no cut was needed. Now, even the futures traders who early this year put money on six to seven cuts, only expect one – in September.
Above all, inflation is proving sticky. In the 12 months to March, core PCE (personal consumption expenditures), which is the Federal Reserve’s favorite, increased 2.8 percent. In February 2022, this metric was growing at a four-decade high of 5.6 percent. Viewed this way, the Fed’s tightening campaign, which took the funds rate from a range of zero to 25 basis points in March 2022 to between 525 basis points and 550 basis points last July, is working its way through the economy. At the same time, inflation remains sizably above the Fed’s two percent goal and progress is slow. Last December, core PCE grew 2.9 percent year-over-year.
If anything, Powell next Wednesday can only sound hawkish – but probably not hawkish enough to be open to a hike, if the need be. Markets would not like a tighter outlook – at all.
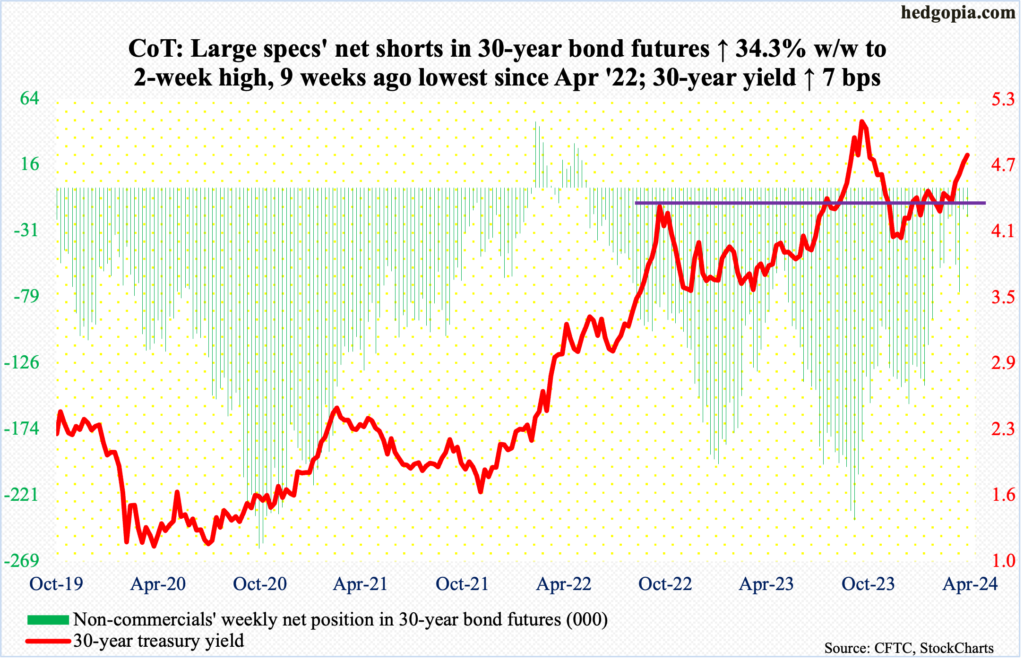
30-year bond: Currently net short 21.2k, up 5.4k.
Major US economic releases for next week are as follows.
The employment cost index (1Q24) and the S&P Case-Shiller Home Price Index (March) are due out Tuesday.
In 4Q23, private-industry total comp increased 4.1 percent from the corresponding quarter in 2022. This was the slowest rate of growth in nine quarters, with 2Q22 registering a jump of 5.5 percent, which was a 38-year high.
Nationally in January, home prices rose six percent year-over-year. Prices fell for three months in April through June last year before turning up again.
On Wednesday, the ISM manufacturing index (April) and job openings (March) are on tap.
Manufacturing activity jumped 2.5 percentage points month-over-month in March to 50.3 percent. This was the first month of expansion in 16 months.
Non-farm job openings in February inched up 8,000 m/m to 8.8 million. The series has trended lower since reaching a record 12.2 million in March 2022.
Labor productivity (1Q24) and durable goods orders (March, revised) are scheduled for Thursday.
Non-farm output per hour grew 2.6 percent in 4Q23 from a year ago. This was the largest increase in 11 quarters.
Orders for non-defense capital goods ex-aircraft – proxy for business capex plans – increased 0.15 percent m/m to a seasonally adjusted annual rate of $73.8 billion. The all-time high of $74 billion was hit last November.
Friday brings payroll (April) and the ISM services index (April).
The economy created 303,000 non-farm jobs in March – for a monthly average this year of 276,000, versus a monthly average last year of 251,000 and 377,000 in 2022.
Non-manufacturing activity in March declined 1.2 percentage points m/m to 51.4 percent – a three-month low. This represents the 15th consecutive month of expansion after one month of contraction in December 2022.
WTI crude oil: Currently net long 278.4k, down 21.7k.
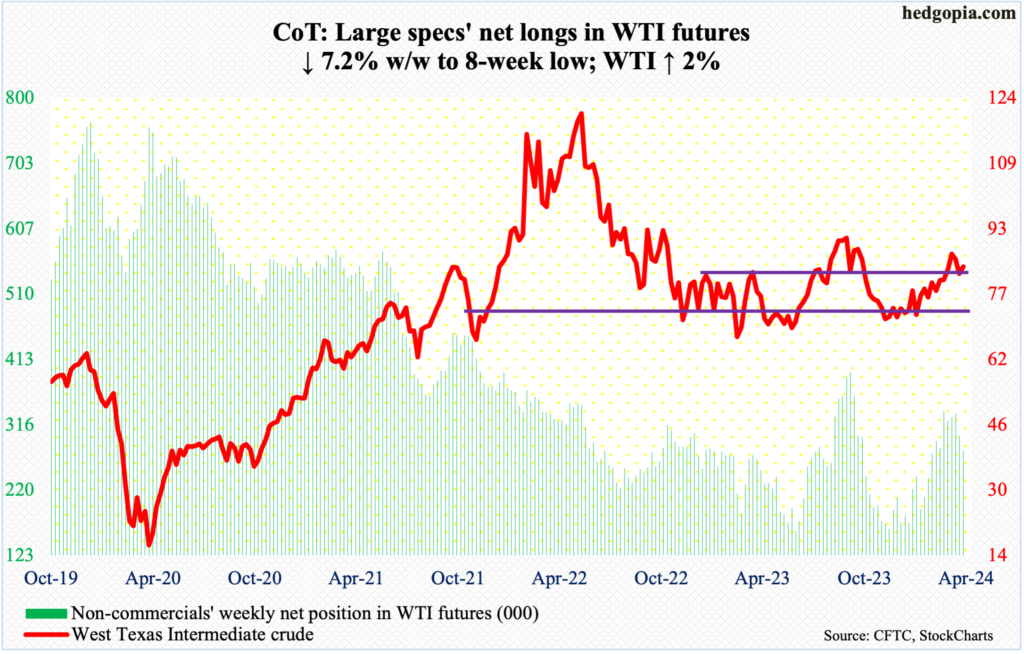
After dropping from $87.67 on the 12th to Monday’s low of $80.70, West Texas Intermediate crude quickly gave back nearly seven points intraday in seven sessions. Earlier, it bottomed at $67.71 last December.
Selling stopped at the 50-day, with the crude hugging the average ($81.49) for four sessions, ending the week up two percent to $83.85/barrel. With this, oil bulls also defended breakout retest at $81-$82. WTI went back and forth between $71-$72 and $81-$82 for 19 months before pushing through the upper end a month ago.
The weekly remains overbought, but the ball remains with the bulls so long as they defend $81-$82.
In the meantime, US crude production in the week to April 19th was unchanged for seven consecutive weeks at 13.1 million barrels per day; nine weeks ago, output was at a record 13.3 mb/d. Crude imports increased 36,000 b/d to 6.5 mb/d. As did distillate inventory, which rose 1.6 million barrels to 116.6 million barrels. Stocks of crude and gasoline, however, dropped 6.4 million barrels and 634,000 barrels respectively to 453.6 million barrels and 226.7 million barrels. Refinery utilization rose four-tenths of a percentage point to 88.5 percent.
E-mini S&P 500: Currently net long 67.7k, down 6.4k.
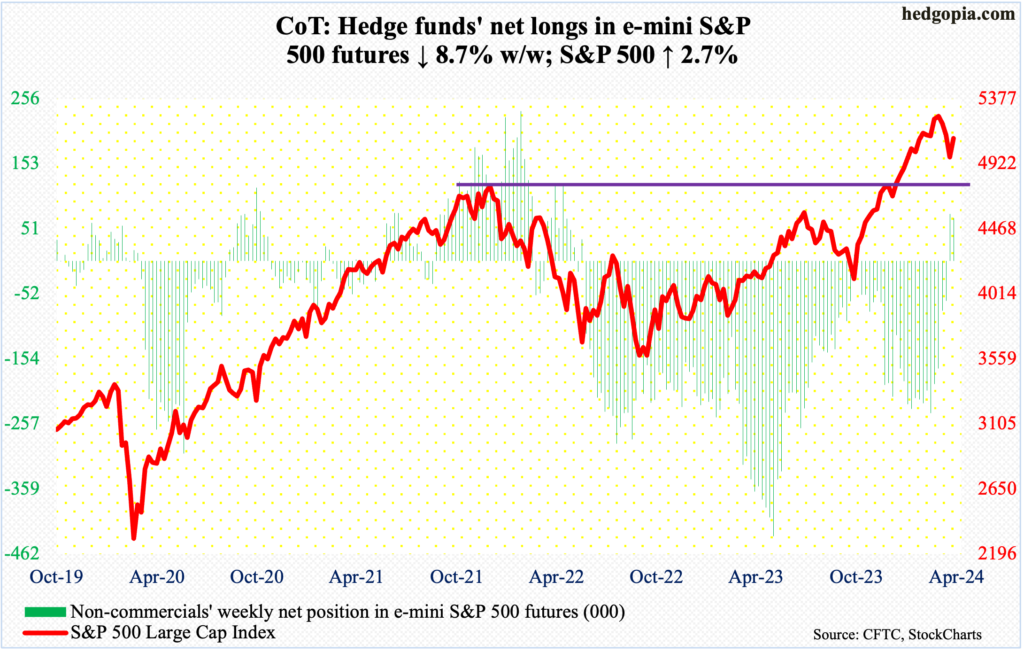
Equity bulls’ mettle is being tested and it will only get intense next week. They put their foot down this week after the S&P 500 gave back 5.9 percent intraday from the March 28th high. The large cap index ticked 5265 in that session and turned lower, having tried and failed to clear 5260s in three sessions over seven.
Last Friday, the index tagged 4954. This week, it rallied 2.7 percent to 5100, with Friday’s intraday high of 5115, which just about tested the 50-day at 5124. The S&P 500 has been under the average for 10 sessions now.
Concurrently, several daily indicators such as the RSI have approached the median, and this is a decision time for the bulls – as well as for the bears. If the RSI, for instance, turns back down, then the latter will be eyeing at least last Friday’s low.
In due course, breakout retest at 4819 is just a matter of time. That was the prior high from January 2022 and the S&P 500 waited two years to surpass the old high this January.
Sentiment has taken a hit in recent weeks, but not low enough to signal a durable bottom (more on this here).
Euro: Currently net short 10k, up 22.2k.
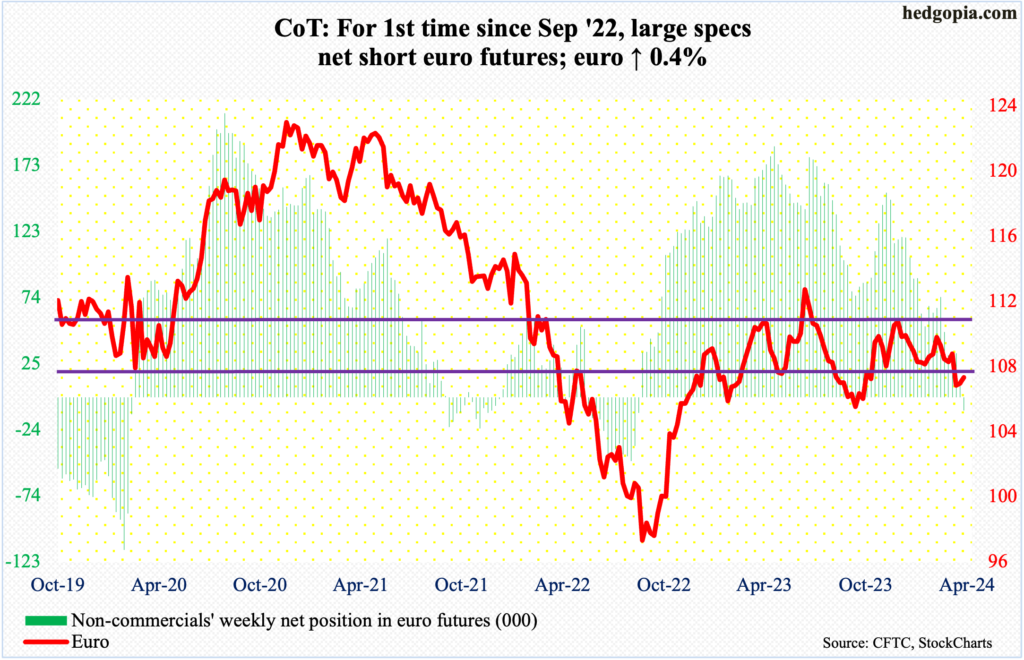
For the first time since September 2022, non-commercials switched to net short euro futures. They have been reducing their bearish bias for a while now, as they were net short 187,089 contracts mid-May last year.
The cash is itching to go the other way. Last week, the euro bottomed at $1.0601, having been under pressure since ticking $1.0981 on March 8th. Before that, it touched $1.1125 last December.
This week, the currency rallied 0.4 percent to $1.0694 – its second up week in a row – but faced difficulty at $1.07, which is support-turned-resistance. Until this level gets taken out, euro bulls will be on the defensive. The daily RSI is turning back down at the median.
Gold: Currently net long 202.9k, up 968.
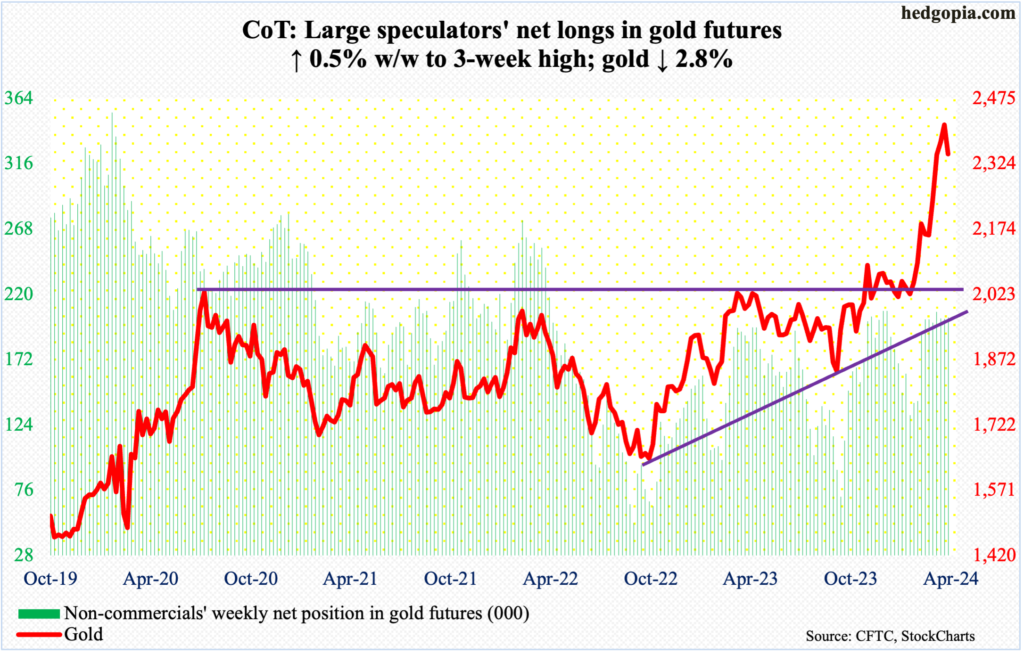
Gold is either healthily digesting its massive gains since last October or is on the way to unwinding the overbought condition it is in.
On the 12th, the metal printed a new intraday high of $2,449 but only to then reverse hard to close the session at $2,361. This preceded a nearly parabolic move higher. Last October, gold bottomed at $1,824 and tagged $2,047 as recently as March 1st.
Since the peak two weeks ago, gold has acted tentative, with this week down 2.8 percent to $2,347/ounce. The weekly particularly is way overbought, and this raises the risk to a move lower toward near-term support at $2,240s. Worse, gold bugs will be forced to defend breakout retest at $2,080s, which the yellow metal broke out of in early March.
Nasdaq (mini): Currently net long 6.1k, down 2.4k.
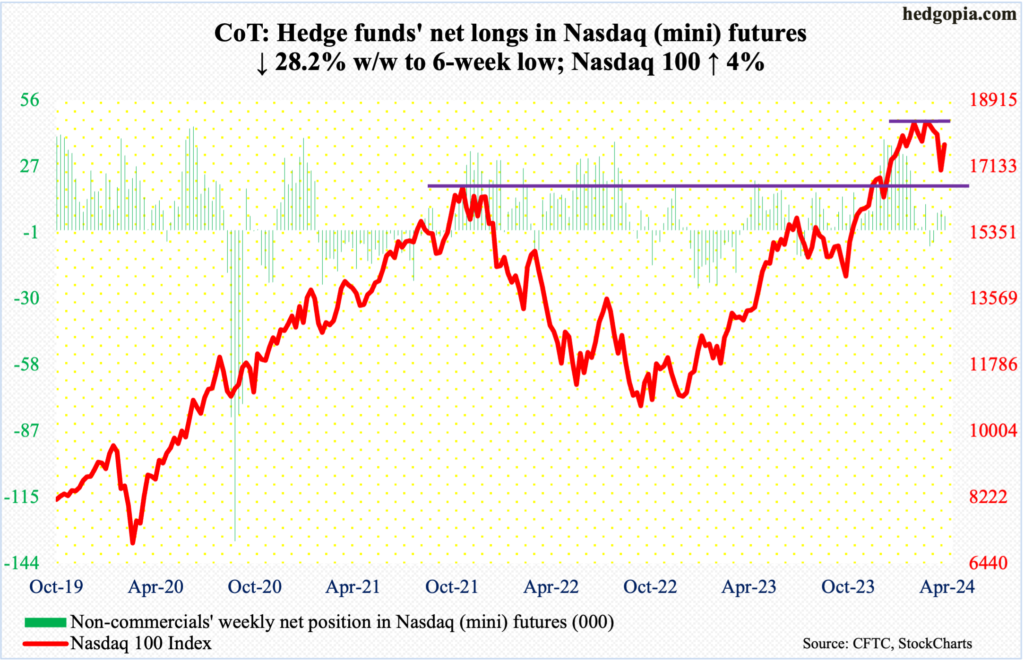
The Nasdaq 100 had a topsy-turvy week, with a high of 17773 and a low of 17010. Until Thursday, it touched 17172 intraday; early on it that session, bulls were on the back foot reacting to Meta’s (META) March-quarter results. Then, come Friday, they came roaring back on the back of results from Microsoft (MSFT) and Google owner Alphabet (GOOG). In the end, tech bulls could not have asked for more (more on this here). The tech-heavy index shot up four percent for the week to 17718.
This came after four consecutive down weeks. The Nasdaq 100 posted a new intraday high of 18465 on March 21st but failed to sustainably break out of 18300s for seven weeks before rolling over. By last Friday, it ticked 16974, down 8.1 percent from the high.
Next week, Amazon (AMZN) reports on Tuesday and Apple (AAPL) on Thursday. If these results help and the index continues higher, the 50-day, which was breached 10 sessions ago, is at 17939. After that comes 18200, which is where trendline resistance from the March 21st high, rests.
Russell 2000 mini-index: Currently net short 36.1k, down 2.4k.
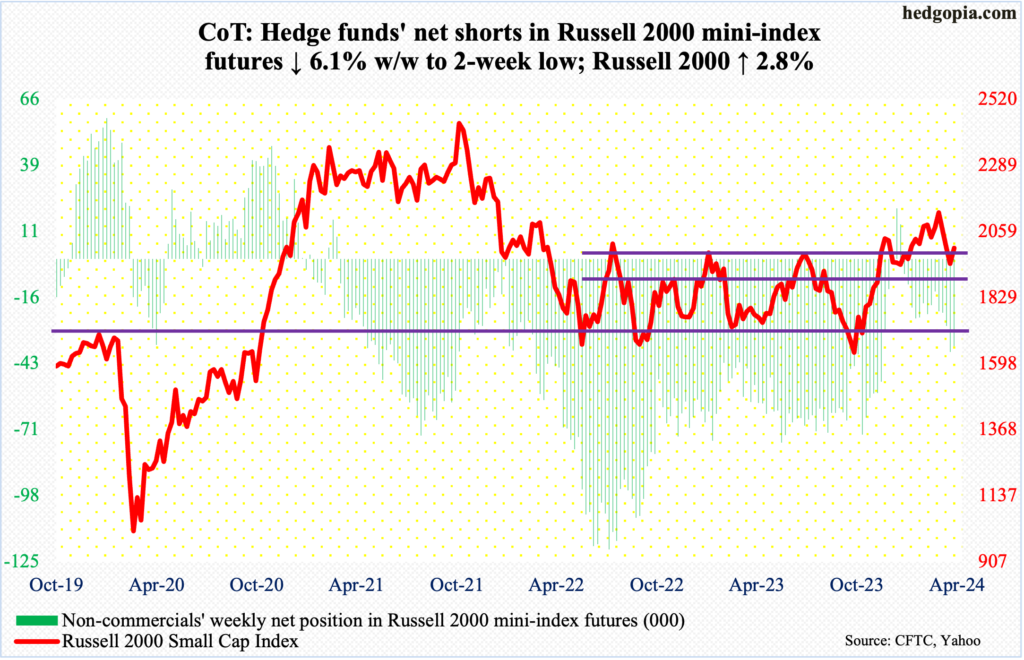
The Russell 2000 is back at 2000, closing up 2.8 percent this week to 2002; last week, it fell by the same amount from 2003. There is decent support/resistance at 2000. Earlier, after several attempts for a month through early this month, small-cap bulls failed to convincingly break out of 2100. Subsequently, the index dropped to 1932 last Friday.
As things stand, it is a toss-up between the bulls and bears. Inability to push through 2000 eventually opens the door to breakout retest at 1900. On December 13th, the index broke out of a 1700-1900 range in place since January 2022.
US Dollar Index: Currently net short 213, down 716.
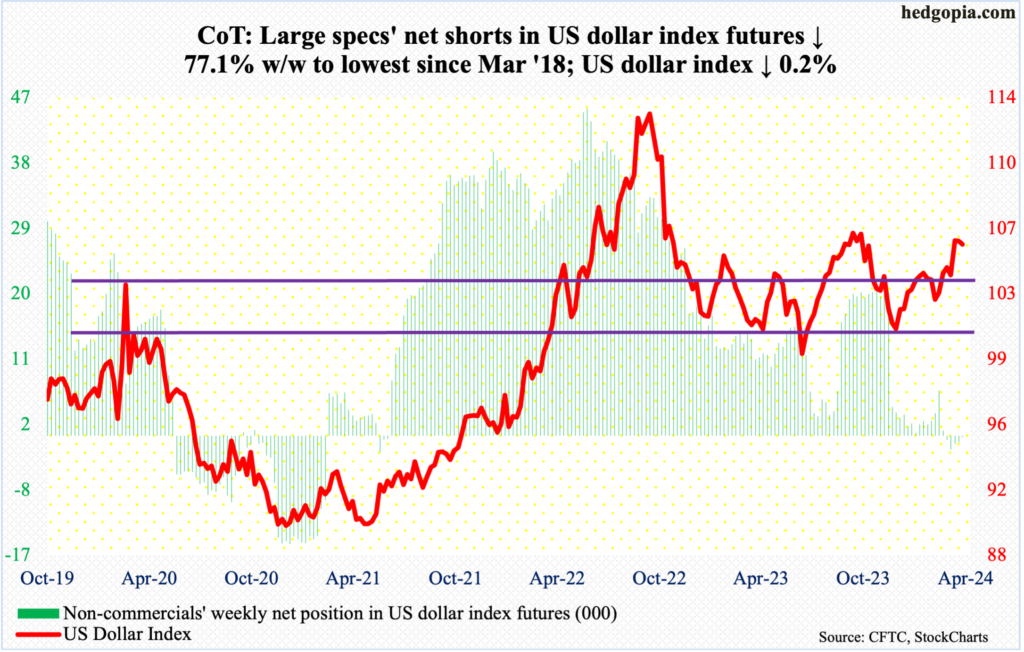
The US dollar index suffered its back-to-back down week, although the decline has been nothing to write home about. This week, it closed at 105.80, versus last week’s close of 105.98 and 106.01 before that.
Dollar bulls were unable to build on a 1.9-percent jump three weeks ago. Selling pressure has picked up just north of 106. Ideally, they would have loved to test 107, which between early October and early November last year rejected rally attempts several times.
Earlier, the index bottomed at 100.32 last December, followed by a takeout three weeks ago of 103-104, which goes back to December 2016.
On the weekly, the path of least resistance is down.
VIX: Currently net short 18k, down 4.5k.
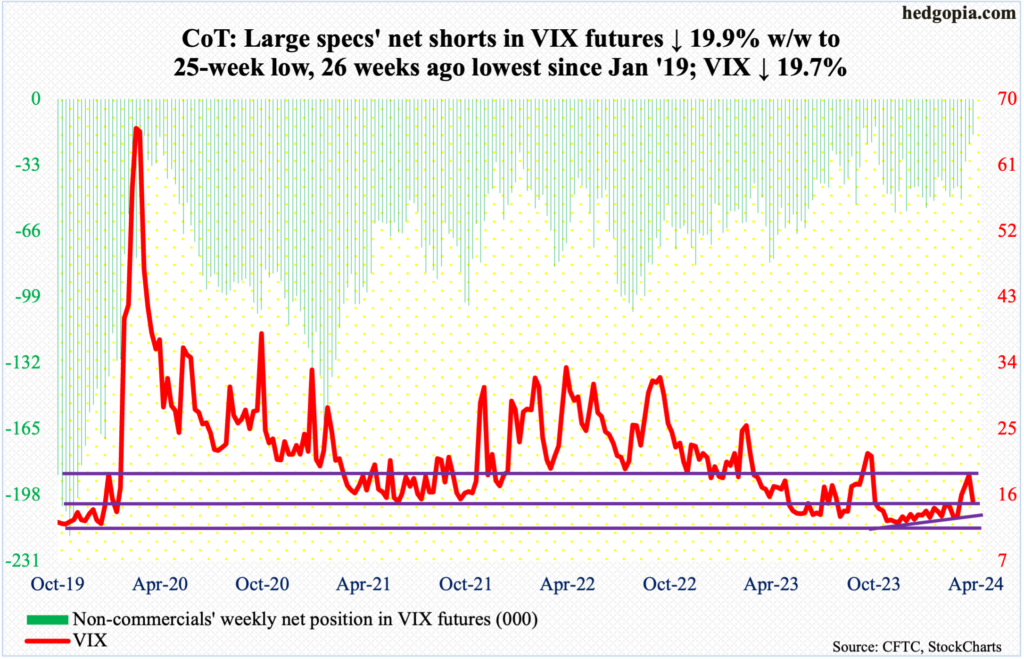
After three up weeks – each of them with long upper wicks – VIX tumbled 3.68 points this week to 15.03. The 50- and 200-day are right underneath – 14.84 and 14.87 respectively. If volatility bulls fail to save these averages, the index could test the 13 handle in no time. Next week is key.
Non-commercials, in the meantime, continued to reduce net shorts in VIX futures. At 18,000 contracts, holdings are at a 25-week low. In the week to October 31st last year, when equities were bottoming, these traders cut net shorts to 13,979 before accumulating again. Historically, VIX has tended to peak as these traders either go net long or get close to doing that.
Thanks for reading!
