
Major US equity indices took it on the chin last week. Medium- to long-term, there is more to go on the downside – if nothing else just to unwind overbought conditions. Near-term, in the right circumstances for bulls, a relief rally is possible. They were willing to step up in defense of important support last Friday.
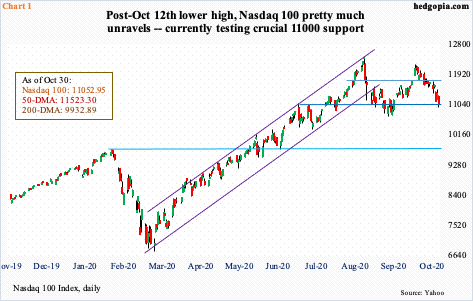
The Nasdaq 100 lost 5.5 percent last week. From the October 12th intraday high, it is down 9.4 percent and down 11.1 percent from the September 2nd record high of 12439.48. A lower high is in place.
Bears will have significantly increased their odds should they succeed in decisively pushing the price under 11000. Last Friday, the index (11052.95) dropped to 10960.02 before tech bulls stepped up to defend the level (Chart 1).
In September, 11000 was breached, with a low of 10677.85 on the 21st. But before things could fall apart, bulls put foot down. A rally off of that low culminated in the aforementioned October 12th high.
Once again, the level is being tested. In general, the more a support is tested, the higher the odds it cracks. But the selling the past three weeks has pushed the daily into oversold territory, which offers the bulls a decent opportunity to regroup.
Over in the small-cap arena, things are evolving similarly.
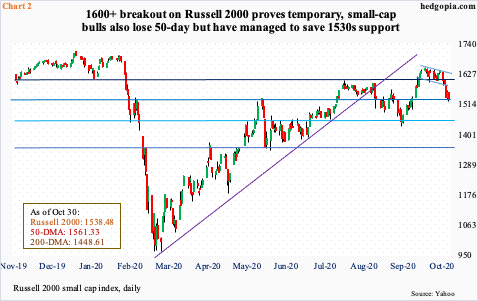
Unlike the S&P 500 and the Nasdaq 100, the Russell 2000 was able to surpass its August/September highs. On the 12th last month, the small cap index rallied to 1652.05 before retreating. By then, it had recaptured 1600-plus, which has proven to be an important price point going back to January 2018. But the breakout did not last very long.
After remaining above 1600-plus for 12 sessions, the Russell 2000 (1538.48) could no longer defend breakout retest last week. The 50-day (1561.33) was breached as well. On both Thursday and Friday, bears then showed up at the broken average. They had already denied longs an opportunity to convert a potentially bull flag (Chart 2).
Amidst all this, bulls can draw solace in the fact that in the latter sessions of last week horizontal support at 1530s was tested and saved.
Bulls also defended important support on the S&P 500.
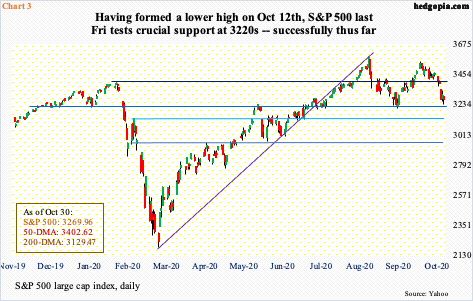
On September 2nd, the large cap index made a new intraday high of 3588.11. In doing so, it essentially kissed the upper line of an ascending broadening wedge from early 2018 (chart in this post). That resistance held. The subsequent drop stopped at 3209.45 on the 24th that month. There is important support at 3220s, which was tested again last Friday as the S&P 500 dropped to 3233.94 (Chart 3). Before this, the index made a lower high on October 12th at 3549.85.
A breach of 3220s, not to mention the 200-day at 3129.47, can accelerate selling. Near-term, the daily is oversold. As long as 3220s is intact, a relief rally is the path of least resistance.
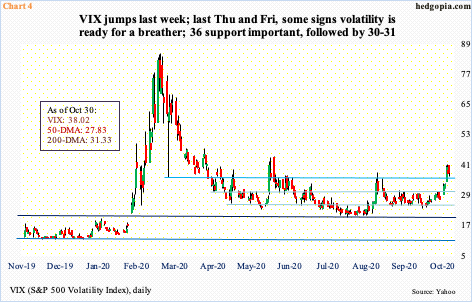
Not surprisingly, volatility picked up last week. VIX surged 38 percent and was up as much as 49.4 percent at Thursday’s high. The intraday high of 41.16 in that session was the highest since June 15th when VIX peaked at 44.44.
Both the 50- and 200-day are now rising. On the monthly, several indicators including the RSI and stochastics have turned up from the median. Longer-term, VIX’s path of least resistance is up. Near-term, last Thursday produced a spinning top with a very wide range. Friday, too, VIX (38.02) rose as high as 41.09 intraday but volatility bulls were unable to hang on to the gains.
The daily is overbought. In the past, a spike reversal tended to precede a contraction in volatility. Thus far, there has not been a decisive reversal session, although action last Thursday and Friday come close. If volatility takes a breather near term, 36 is the nearest support, followed by 30-31 (Chart 4).
[Our own Hedgopia Risk Reward Index is now in the green zone (chart on the home page).]
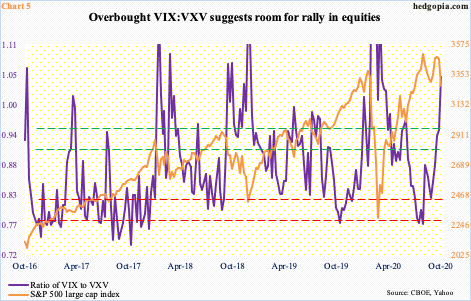
In a scenario in which VIX comes down, its ratio with VXV can begin a process of unwinding its overbought condition.
VIX measures the stock market’s expectation of 30-day volatility based on S&P 500 options. VXV achieves the same, but for a longer duration – three months. Typically, when investors are in a mood to take on risk, demand for nearer-term protection goes down; the opposite occurs when the mood shifts to risk-off.
Accordingly, a falling ratio of VIX to VXV suggests rising complacency and a rising ratio suggests rising caution. Currently, the pendulum has swung toward the latter (Chart 5). Last Friday, it printed 1.05, which on a closing weekly basis is the highest since the week of March 23rd. Back then, the S&P 500 bottomed on that very Monday.
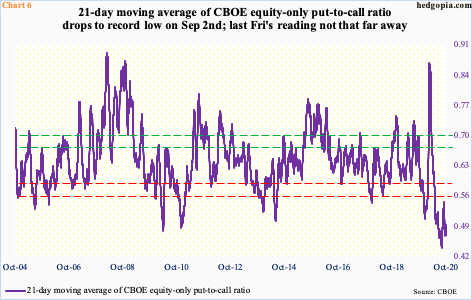
Of course, this points to potential relief for equity bulls in the near term. Longer-term, they have Chart 6 to worry about. The 21-day moving average of the equity-only put-to-call ratio continues to point to extreme complacency.
On September 2nd, the ratio hit 0.439. The S&P 500 peaked on that date. Last Friday, it closed at 0.494. Historically, greed transitions to fear as the ratio rises to high-0.60s to low-0.70s (Chart 6). There is still quite a ways to go before that happens.
Unwinding of overbought conditions does not always have to occur in a straight line.
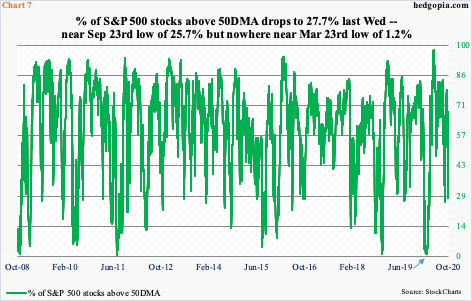
During the February-March selloff, when the S&P 500 collapsed over 35 percent in a little over a month, the percent of S&P 500 stocks above their 50-day dropped to 1.2 percent on both March 20th and 23rd and to one percent on March 12th. Last Friday, this metric was at 30.5 percent, having earlier dropped to 27.7 percent on Wednesday. In late September, it reversed higher after dropping to 25.7 percent on the 23rd. It is possible a similar bounce occurs. It is equally possible it goes much lower for a complete washout – like the one experienced in March.
Tuesday’s election is the wildcard. Whichever candidate wins, markets likely will celebrate a clean, uncontested victory. As they likely will, if there is a Blue sweep, with the Democrats winning both the White House and the Senate. A litigious outcome can complicate things. Ahead of the election, traders have been reducing risk. So, it is possible it is in the price – magnitude notwithstanding.
This has created opportunities for daredevil put sellers. In the options market, SPY Nov 4th 310 puts are going for $2.01. The ETF closed last Friday at $326.54. The strike is 5.1 percent away, with the option expiring the day after the election. Importantly, SPY’s 200-day lies at $310.29. For a breach of the average to occur at the very first try, the election outcome probably needs to be really messy, especially considering that the daily is in oversold territory. Otherwise, it can prove to be a nice premium to keep.
Thanks for reading!
