Following futures positions of non-commercials are as of June 6, 2017.
10-year note: Currently net long 212.1k, down 46.1k.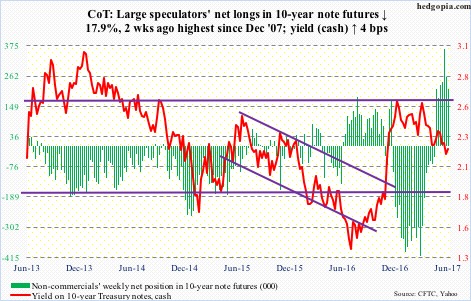
The Fed is all set to hike next week. Futures are pricing in 99.6-percent odds of a 25-basis-point increase. This will be the fourth increase since December 2015. (The other two were December 2016 and March 2017.)
After next week’s hike, the fed funds rate sits between 100 and 125 basis points. Still massively accommodative, but at the same time conditions at the short end have tightened by 100 basis points. Hence the question, in the larger scheme of things, how restrictive are things?
Not much is the short answer.
A day after the hike in December 2015, the yield curve (10s/2s) peaked at 130 basis points; Friday, it narrowed to 86 basis points. This is stealth easing. As is the US dollar index, which went from 99.32 to 97.24.
Along the same lines, between December 2015 and now, 30-year fixed-rate mortgage is unchanged at just under four percent. As is five-year auto loan at just north of four percent.
And of course, QE did end in October 2014, but the Fed continues to reinvest principal payments and maturing securities.
The bottom line: despite the Fed’s tightening bias, financial conditions in the aggregate have not tightened much.
30-year bond: Currently net long 22.9k, up 1.9k.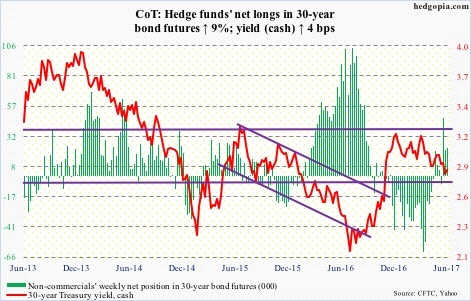
Major economic releases next week are as follows.
FOMC meeting begins Tuesday, and ends the next.
Also on Tuesday, the NFIB optimism index (May) and PPI-FD (May) are published.
Small-business optimism fell two-tenths of a point month-over-month to 104.5 in April. The index has been north of 100 for the past five months. From 94.9 last October to 105.9 in January – a 12-year high – optimism took off post-election.
Producer prices rose 0.5 percent m/m in April. In the 12 months through April, PPI increased 2.5 percent. Core PPI rose 0.7 percent m/m in April and 2.1 percent over 12 months.
Wednesday brings CPI (May) and retail sales (May).
Consumer prices rose 0.2 percent m/m in April and 2.2 percent in the 12 months through April. Core CPI inched up 0.1 percent m/m in April and 1.9 percent over 12 months. This was the first sub-two percent rise in core CPI in the past 18 months.
Retail sales rose 0.4 percent m/m in April to a seasonally adjusted annual rate of $474.9 billion.
Industrial production (May), the NAHB housing market index (June), and the Treasury International Capital (April) come out on Thursday.
April industrial production increased 2.2 percent year-over-year. This was the fifth consecutive up month after 20 straight y/y contraction.
In 1Q this year, foreigners net-purchased $34.9 billion in U.S. equities. A trend reversal? In February last year, on a 12-month rolling total basis, they sold $142 billion worth – a record.
Home builder sentiment in May rose two points m/m to 70. March was 71 – the highest since 72 in June 2005.
Housing starts (May) and the University of Michigan’s consumer sentiment (June, preliminary) are on tap for Friday.
Builders are not putting money where their mouth is. Housing starts fell 2.6 percent m/m in April to 1.17 million units (SAAR). Starts peaked at 1.33 million last October – the highest since August 2007.
Consumer sentiment in May inched up one-tenth of a point m/m to 97.1. Sentiment reached 98.5 in January – a 13-year high.
Crude oil: Currently net long 452.8k, up 18k.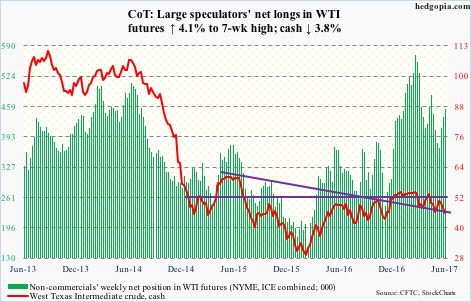
Wednesday’s 5.1-percent decline in spot West Texas Intermediate crude was due to a combination of two things: negative EIA report combined with bulls’ inability to save support at $47, which they had defended in the prior three sessions.
The EIA report for the week ended June 2 showed an across-the-board buildup in stocks.
Crude inventory rose 3.3 million barrels to 513.2 million barrels. Gasoline went up by the same amount to 240.3 million barrels, and distillates by 4.4 million barrels to 151.1 million barrels.
Crude imports rose, too, by 356,000 barrels/day to 8.34 million b/d. Refinery utilization fell nine-tenths of a point to 94.1 percent.
Production, for a change, fell 24,000 b/d to 9.32 mb/d. Since OPEC reached a cutback agreement late November last year, U.S. crude production has increased by 619,000 b/d.
Wednesday’s mini-collapse drops the crude ($45.83) right at the daily lower Bollinger band, where things can always bounce. Bulls’ first hurdle: $47.
E-mini S&P 500: Currently net long 58.5k, up 2.4k.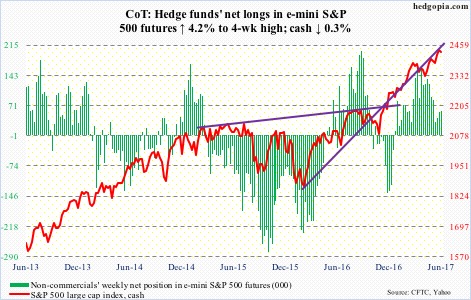
In the week to Wednesday, SPY (SPDR S&P 500 ETF) lost $2.4 billion (courtesy of ETF.com). This was somewhat offset by the $728 million VOO (Vanguard S&P 500 ETF) and IVV (iShares core S&P 500 ETF) pulled in together. The latter two have not experienced outflows in the past couple of months.
Also in the week ended Wednesday, $5 billion was withdrawn from U.S.-based equity funds (courtesy of Lipper). In the prior week, $9.2 billion came in.
Before Friday’s wild session, the S&P 500 (cash) essentially went sideways just above the 10-day, which is now flattish. The daily chart looks to be itching to go lower. Bulls needs to defend 2400, which the index broke out of two weeks ago.
As things stand, the stock-to-bond ratio is at a crucial juncture.
Euro: Currently net long 74k, up 1.1k.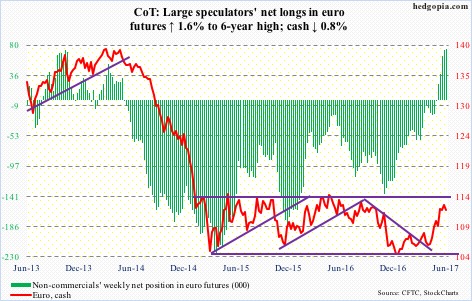
Thursday’s ECB meeting, and the subsequent press conference by Mario Draghi, president, was a yawner. As much as markets were wishing he would, he did not indicate how long QE would last beyond December. “The ECB will be in the market for a long time.” This is despite the fact that economic risks were “broadly balanced.” Back in April, he said risks were “still tilted to the downside.”
The cash (111.96) fell 0.3 percent Thursday, and has room to continue lower. Euro bears need to take out 111.6.
In April, the currency had an important break out of 108-plus, which also approximates the 200-day moving average.
Gold: Currently net long 204.5k, up 37.4k.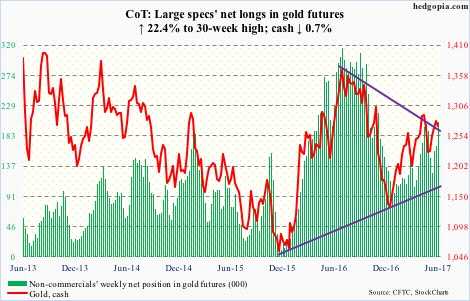
Friday last week, the cash ($1,271.4) poked its head out of a falling trend line from last July, but was unable to build on it this week. The attempt to rally was stopped at resistance at $1,300.
A rising trend line drawn from last December draws to $1,245. This is where the metal’s 200-day lies.
Flows continue to be a problem. Monday, GLD, the SPDR gold ETF, took in $144 million. In the week ended Wednesday, the remaining four sessions saw no activity (courtesy of ETF.com).
Nasdaq 100 index (mini): Currently net long 92.5k, up 12.2k.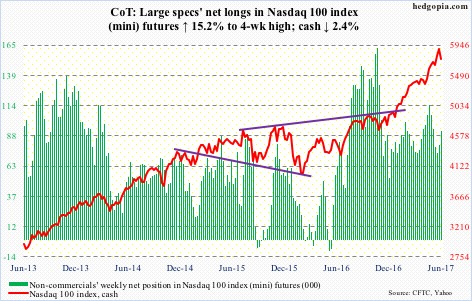
After two weeks of inflows totaling $918 million, QQQ, the PowerShares Nasdaq 100 ETF, in the week ended Wednesday lost $17 million (courtesy of ETF.com).
It will be interesting to find out how flows behaved on Friday. The session – as well as the week – produced a large bearish engulfing candle. There are footprints of institutional exit on all five leading weights – AAPL, GOOGL, MSFT, AMZN, and FB.
Russell 2000 mini-index: Currently net short 35.7k, down 37.4k.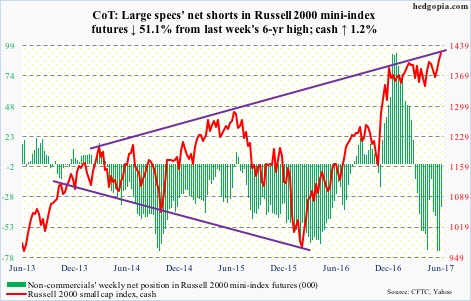
After going sideways between 1340s and 1390s for six months and having unsuccessfully tried to break out twice, the cash finally broke out to a new high of 1433.79, but Friday’s price action is not a confidence booster, as it closed 0.8 percent off the session high.
It increasingly feels like this week’s rally, as well as last week’s, was the result of a squeeze.
As of last Tuesday, non-commercials were net short 73k contracts. It was more than cut in half this week. They probably took another hit this Thursday and Friday, as the cash rallied 2.6 percent.
Bulls’ best hope is if small-caps begin to attract money leaving tech.
So far so good. In the week ended Wednesday, IWM, the iShares Russell 2000 ETF, attracted $477 million. This followed $151 million in inflows in the prior week (courtesy of ETF.com).
US Dollar Index: Currently net long 28.2k, up 517.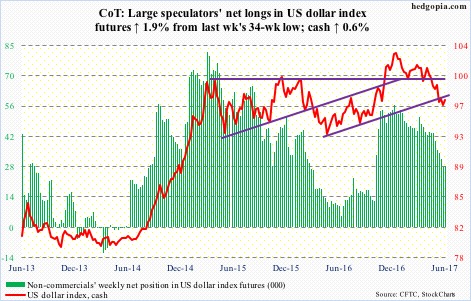
One more week in which the cash (97.24) tried to stabilize by going sideways. The 10-day is now flattish. At least near term, the odds of a rally have grown. Bulls need to rally past 97.40.
At least until Tuesday, this had not yet ignited non-commercials’ interest, although they added a touch.
VIX: Currently net short 135.9k, up 16.9k.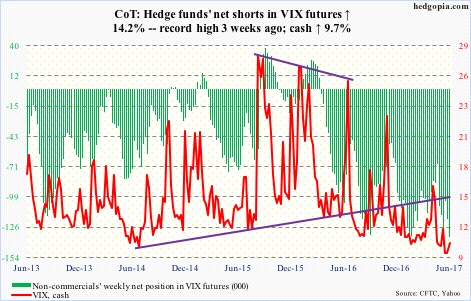
In four of the five sessions, the cash (10.70) dipped below 10 intraday. Friday’s low of 9.37 undercut the low of 9.39 in December 2006. (The all-time low of 8.89 was recorded in December 1993.)
Volatility contraction is in uncharted territory, to say the least!
VIX is already near the bottom of a multi-year range. It does not have much room to go lower. But since the most recent peak on May 18, rally attempts have been consistently sold, including Friday when it rallied to as high as 12.11, only to pull back. That said, the session’s 2.74-point range is indicative of the nervousness out there.
Nervous yet complacent. Monday through Thursday, the CBOE equity put-to-call ratio was in the .50s.

