
Following futures positions of non-commercials are as of July 25, 2017.
10-year note: Currently net long 280.7k, down 1.6k.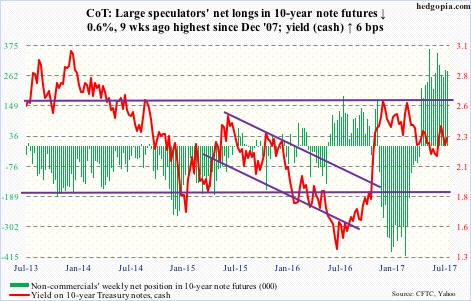
After seven years of keeping the fed funds rate between zero and 25 basis points, the Fed began to hike in December 2015.
Several economic data peaked a lot earlier – capacity utilization at 79.2 percent in November 2014, corporate profits (with inventory valuation and capital consumption adjustments) at $2.2 trillion in 4Q14, real GDP growth at five percent in 3Q14, orders for non-defense capital goods ex-aircraft at $70.3 billion in September 2014, ISM manufacturing at 57.9 in August 2014, etc.
Thus the argument that the Fed missed a window of opportunity by not moving earlier. Will history repeat itself? Is the Fed waiting too long to unwind its bloated $4.5-trillion balance sheet?
The FOMC statement this week said the normalization program would begin “relatively soon”, which probably means September. This assumes economic data continue to cooperate.
More importantly, the Fed needs markets to cooperate, and not throw a tantrum when the time comes.
30-year bond: Currently net long 56.4k, up 4.9k.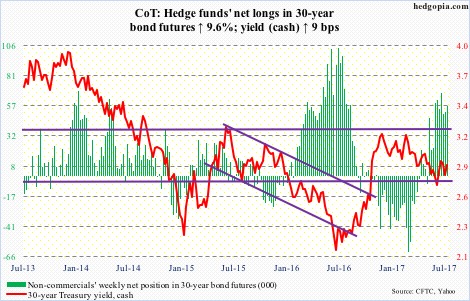
Major economic releases next week are as follows.
The pending home sales index for June is published on Monday. May was down 0.8 percent month-over-month to 108.5. The index has softened since reaching 113.6 in April last year – a 10-year high.
Tuesday brings personal income and outlays (June), and the ISM manufacturing index (July).
Core PCE (personal consumption expenditures) increased at 1.39 percent in the 12 months to May. This is the Fed’s favorite measure of consumer inflation. The last time it grew with a two handle was in April 2012.
Manufacturing activity expanded 2.9 points m/m in June to 57.8 – a 34-month high. Orders jumped four points m/m to 63.5 – a three-month high.
The ISM non-manufacturing index (July) and durable goods (June, revised) are on tap for Thursday.
Services activity inched up five-tenths of a point m/m in June to 57.4, while orders rose 2.8 points m/m to 60.5.
June orders for non-defense capital goods ex-aircraft – proxy for business capital expenditures – fell 0.1 percent m/m to a seasonally adjusted annual rate of $63.4 billion. This was the first m/m decline in six months.
July’s employment report comes out on Friday. In the first half, non-farm payroll grew by a monthly average of 180,000. This compares with a full-year monthly average of 187,000 in 2016, 226,000 in 2015 and 250,000 in 2014.
Crude oil: Currently net long 444.3k, up 15.1k.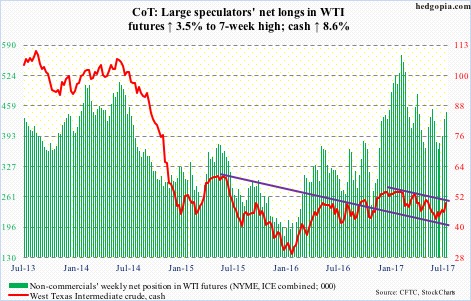
For the week ended July 21, U.S. crude stocks fell 7.2 million barrels to 483.4 million barrels – now down 52.1 million barrels since peaking at 535.5 million barrels in the March 31st week this year. That said, inventory is still higher versus the five-year average of 409.1 million barrels.
Gasoline stocks dropped 1.1 million barrels to 230.2 million barrels – a 30-week low. Distillate stocks declined 1.9 million barrels to 149.6 million barrels – an eight-week low.
Crude production fell 19,000 barrels per day to 9.41 million b/d. Since OPEC reached an agreement to cut back production by 1.8 mb/d last November, U.S. production has gone up by 711,000 b/d.
Crude imports, however, rose 48,000 b/d to 8.04 mb/d – a four-week high.
Refinery utilization inched up three-tenths of a point to 94.3 percent.
Spot West Texas Intermediate crude ($49.71/barrel) started the week strong, and the EIA report, out Wednesday, did not hurt.
Resistance at $47 got taken out. As did the 50-day moving average on Tuesday, and the 200-day on Friday. The crude essentially closed right underneath a declining trend line from last December. If this is won over, $52 is the next level to watch.
E-mini S&P 500: Currently net long 108.2k, up 5.8k.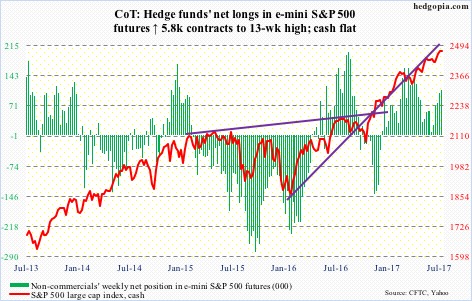
U.S.-based equity funds lost another $1.4 billion in the week to Wednesday. This followed outflows of $2.6 billion in the prior week (courtesy of Lipper).
S&P 500-focused ETFs, however, witnessed healthy inflows, with SPY (SPDR S&P 500 ETF) attracting $5.8 billion, VOO (Vanguard S&P 500 ETF) $104 million and IVV (iShares core S&P 500 ETF) $423 million (courtesy of ETF.com).
They were not of much help, though.
The S&P 500 (2472.1) is beginning to show signs of fatigue, with a weekly doji. Sentiment leans heavily bullish.
As far as SPY is concerned, shorts continue to cut back, and that takes away potential fuel for squeeze.
The first line of support lies at 2450, which also approximates the 20-day, followed by the 50-day (2435.19).
Euro: Currently net long 90.8k, down 479.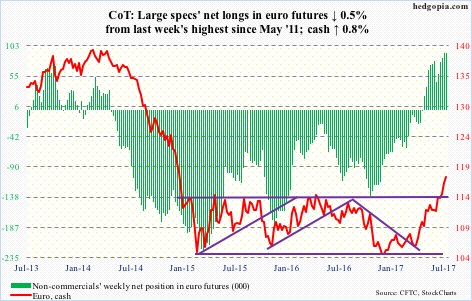
The IMF, in a report this week, said sovereign debt levels in countries like Italy, Portugal and Greece are higher today than when the Eurozone sovereign debt crisis unfolded in 2010. Makes you wonder what might happen to this debt when the ECB ends its QE – whenever that is.
One interesting tidbit from that report: Since 2000, unit labor costs in Germany have declined by a cumulative 15 percent versus a cumulative 10-percent increase in Italy. Issues facing the Eurozone are not uniform. Hence the ECB’s dilemma if it should continue with stimulus or not.
For now, the euro just broke out of a two-and-a-half-year, 10-point rectangle, and remains grossly overbought with momentum intact. Bulls’ first test will be if they can defend the still-rising 10- and 20-day.
Gold: Currently net long 90.8k, up 30.7k.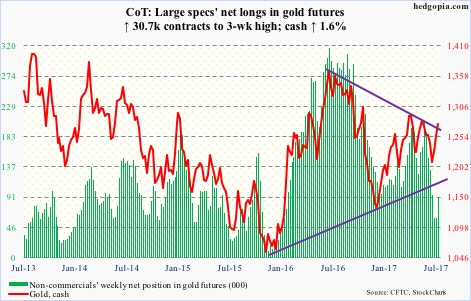
GLD (SPDR gold ETF) continued to see outflows. In the week to Wednesday, the ETF lost $833 million – sixth straight weekly outflows during which $2.4 billion came out (courtesy of ETF.com).
Nonetheless, 14 sessions ago gold bugs did put their foot down on the cash just north of $1,200/ounce. This week, the 50-day, which it broke out of last week, was defended.
The daily chart looks extended, but there is still room to rally on the weekly. Since the cash ($1,275.3/ounce) peaked last July, rally attempts have been bound by a trend line drawn from July last year. The metal poked its head out of it on Friday – potentially significant.
Nasdaq 100 index (mini): Currently net long 53.3k, up 14.5k.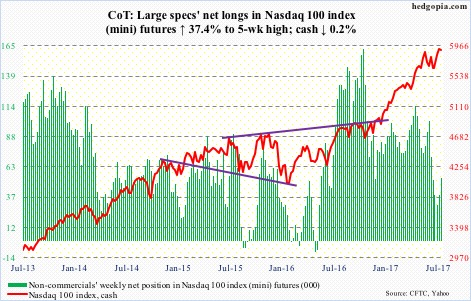
Thursday saw the cash (5908.92) rise to yet another high – 5995.77 – but only to reverse hard at midday. Post-earnings reaction to Alphabet (GOOGL) and Amazon (AMZN) were negative, Facebook (FB) rallied but closed poorly – up 2.9 percent versus up six percent at one time. Apple (AAPL) reports Tuesday.
Through Thursday’s high, the Nasdaq 100 rallied 7.5 percent since bottoming on July 6. Momentum is beginning to wane. The week produced a spinning top. The nearest support the bulls need to save is the 50-day (5777.52).
Flows are challenged.
In the week through Wednesday, QQQ (PowerShares Nasdaq 100 ETF) lost $2.6 billion, versus inflows of $3.1 billion in the prior two (courtesy of ETF.com).
At least near term, elevated short interest on QQQ, XLK (SPDR technology ETF), or the Nasdaq composite, may end up creating a floor as bruised shorts are tempted to cover.
Russell 2000 mini-index: Currently net short 30.7k, up 679.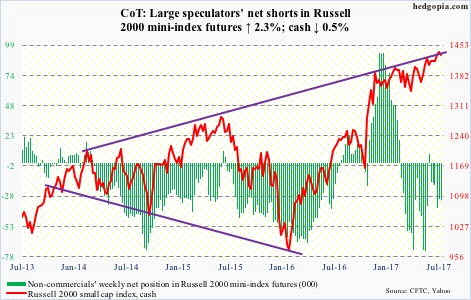
The cash came under pressure right after scoring an intraday high of 1452.09 on Tuesday, essentially matching last week’s high. For the second week running, the upper bound of a rising channel from last December repelled rally attempts.
The path of least resistance is down.
The 50-day lies at 1410.71. After that lies breakout retest at 1390s.
The Achilles’ hill continues to be IWM (iShares Russell 2000 ETF) flows. In the week to Wednesday, $1.6 billion was redeemed – and $4.6 billion in the past five (courtesy of ETF.com).
US Dollar Index: Currently net short 2.5k, down 4.6k.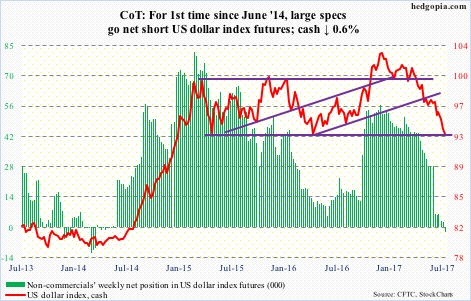
For two and a half years, barring a false breakout last November, the cash (93.11) has been range-bound between 100.70 and 93-plus. It is clinging on to that support.
Between the high early this year and the low this week, it shed 10-plus percent. Enough of a drop for the bears to cover and non-commercials to accumulate net longs? At least the latter still show disinterest. They went net short this week – the first since June 2014.
The index is so oversold a technical bounce is possible anytime. Immediately ahead, levels to watch include 93.95, 95.30 and 96.50. The 50-day lies at 96.08.
VIX: Currently net short 136.6k, down 3.7k.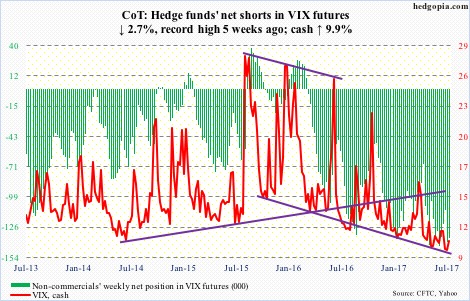
An all-time low of 8.84 on Thursday on the cash – past prior low of 8.89 on December 27, 1993.
In its 27-plus-year history, VIX closed below 10 26 times; 16 of these occurred since May 8 this year.
No wonder non-commercials have accumulated near-record net shorts in VIX futures. There is also massive short interest on VXX (iPath S&P 500 VIX short-term futures ETN). This is potential fuel for squeeze, if volatility bulls can get their act together.
From their perspective, the good news is Wednesday was a hammer, followed by another good session Thursday, although with a long wick. Importantly, shorter-term moving averages are flat to slightly rising.
Thanks for reading! Please share.
