
Stocks took it on the chin last week. Friday, major US equity indices all tested major averages – successfully. A relief is possible near term. Medium term, though, more pain probably lies ahead.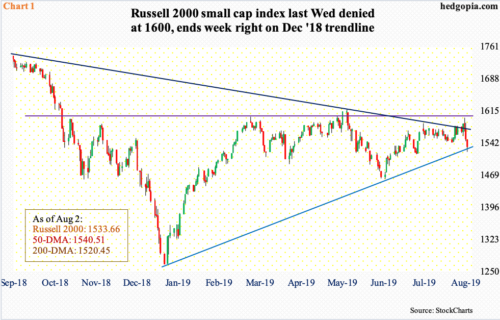
Last Wednesday, the day the Fed lowered interest rates by 25 basis points – its first cut since December 2008 – small-cap bulls went after what has proven to be an important price point since January last year.
The Russell 2000 small cap index peaked last August at 1742.09, followed by a loss in October of 1600-plus. The index bottomed in December, but the subsequent rally stopped right at that resistance in February and then again in April and May. In contrast, large-caps went on to rally to new, and newer, highs.
For revival of risk-on sentiment, 1600-plus needed to go. Last Tuesday, small-cap bulls took care of a falling trend line from that August 2018 high. This laid the foundation for Wednesday’s breakout attempt when the index rallied to 1599.40 intraday but only to reverse hard, closing at 1568.40. Once again, bears prevailed. Selling continued in the next two sessions.
For the week, the Russell 2000 (1533.66) gave back 2.9 percent. For bulls’ consolation, the 200-day moving average (1520.45) was defended. Ditto with a rising trend line from last December (Chart 1).
On the S&P 500 large cap index, the December 2018 trend line was not quite tested last Friday (Chart 2), but the 50-day was. In fact, the average was breached by a decent amount intraday, but bulls managed to reclaim it by close.
On the way down, bulls lost short-term support at 2950-60s, which the S&P 500 (2932.05) broke out of early July. The index pulled back 3.1 percent last week. In the event of a relief rally near term, bears likely will try to defend that support-turned-resistance.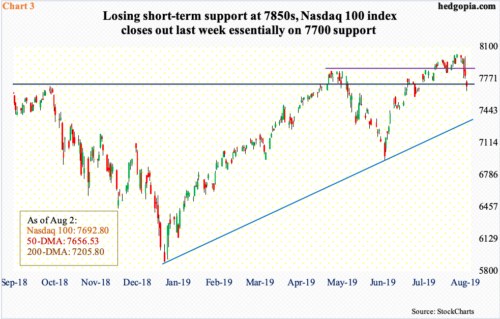
Similar dynamics are in play on the Nasdaq 100 index (7692.80). As did the S&P 500, it, too, rallied to a new record high six sessions ago. Last Friday, it, too, tested the 50-day – successfully. And, on the way down last week, it, too, lost short-term support at 7850s (Chart 3). This is where bears are likely to show up should a relief rally ensue in the sessions ahead.
Last week, the Nasdaq 100 gave back four percent, closing right on one-year horizontal support at 7700 (Chart 3). It is yet to test trend-line support from last December.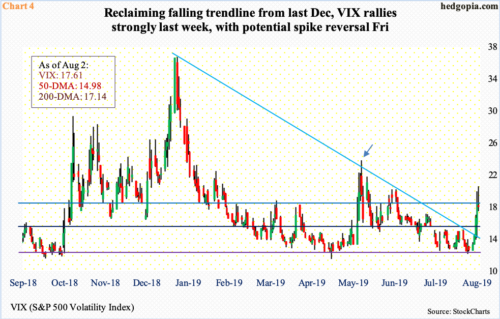
Whether or not a relief rally unfolds near term likely gets decided by how volatility fares this week. VIX shot up last week, up 5.45 points to 17.61. Merely seven sessions ago intraday, it reached a low of 11.69, just above the daily lower Bollinger band, before beginning a rally that culminated in Friday’s high of 20.11. This was the highest since May 13 this year. Back then, VIX reversed after spiking to 23.38 on May 9 (arrow in Chart 4). The S&P 500 fell throughout May, bottoming early June (Chart 2).
If past is prologue, a potential spike reversal in VIX is worth watching. Several times in the past, after a spike, VIX has tended to peak, while in others, it has gone on to supersede the spike high before wind is taken out of its sails. Last Friday, as mentioned earlier, VIX rose as high as 20.11, only to close the session down 0.26. This was a session in which the S&P 500 dropped 0.7 percent. Hence the significance of the next few sessions.
On the daily, VIX is getting overbought. It is possible it tries to unwind that condition near term before getting bid up again. Last week, it did break out of a falling trend line from last December’s high. It is currently just above the 200-day and the 50-day below that. The latter is beginning to curl up.
Chart 5 presents another metric that uses VIX as one of the variables – VIX in the numerator and VXV in the denominator. VIX measures 30-day forward volatility using S&P 500 options. VXV does the same, except it goes out to three months. When stocks are getting bid up, premium tends to come out faster from shorter-term volatility, in this case VIX. When stocks come under pressure, VIX gets bid up more than VXV.
As a result, in late May when the S&P 500 was on its way to bottoming out, the VIX-to-VXV ratio peaked at 0.994 (close, not intraday). Stocks rallied in all of June and through July 26 when they crested. Throughout this uptrend, the ratio came under pressure, having bottomed at 0.828 in the week before. Then, as stocks came under pressure last week, it shot up, ending at 0.984. It is possible last week’s increase came too far too fast. It is equally possible the ratio continues higher, as it has done in the past. Near term, it is a coin toss.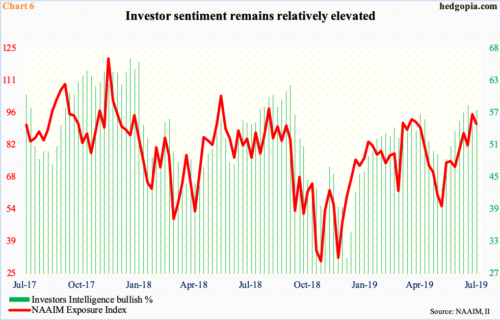
Medium term, things are different. VIX, for instance, has not even surpassed the early-May high. Investor sentiment is still elevated.
Last week, Investors Intelligence bulls rose three percentage points week-over-week to 57.2 percent. Two weeks before that, bulls were 58 percent, which was the highest since 61.8 percent early October, when the bottom fell out of stocks. Even if sentiment rises a tad, historically it is hard to sustain 60 percent or higher.
The NAAIM Exposure Index is the same way. It represents members’ average exposure to US equity markets. Readings of 100 or higher are rare; the last one was mid-June last year. Post-December lows, the highest reading was recorded two weeks ago at 95.75. Last week, it fell 4.34 points to 91.41, but is still above 90. It has not even begun to genuinely correct. As recently as early June, it dropped to 54.99 (Chart 6).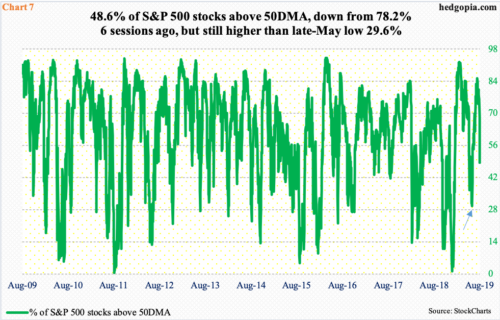
Along the same lines, the percent of S&P 500 stocks above the 50-day dropped to 29.6 percent late May (arrow in Chart 7), as the index was in the process of bottoming. Last Friday, 48.6 percent were still above the average. Six sessions ago, 78.2 percent were. Viewed this way, it has corrected. But there is a long way to go on the downside before a durable bottom is reached. On Christmas Eve last year, the metric bottomed at 1.2 percent. From the December low through July’s record high, the S&P 500 jumped 29 percent.
This is the reason why, should bulls manage to put their foot down in the sessions ahead, that in all probability would not mark a durable bottom, rather merely a relief rally to unwind short-term oversold condition. Medium term, overbought weekly momentum indicators have just begun to unwind.
Thanks for reading!
