
U.S. stocks have come a long way since February 11th.
Intra-day, off that low through last Friday’s high, here is how much major U.S. indices have rallied: Dow Industrials, 10.1 percent; S&P 500 large cap index (Chart 1), 11 percent; Nasdaq 100 (Chart 2), 11.6 percent; Dow Transports (Chart 3), 13.7 percent; and Russell 2000 small cap index (Chart 4), 15.4 percent, among others.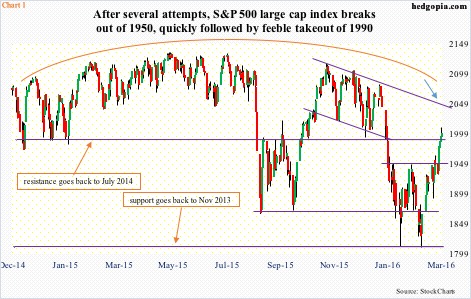
They have all retaken their respective 50-day moving averages, as well as broken out of two-month-old horizontal resistance.
They have achieved all this without so much of catching breath. Daily conditions have remained in overbought territory for two weeks now.
Nonetheless, no sooner did the indices take out the afore-mentioned resistance than they are attacking another one. This one is a biggie.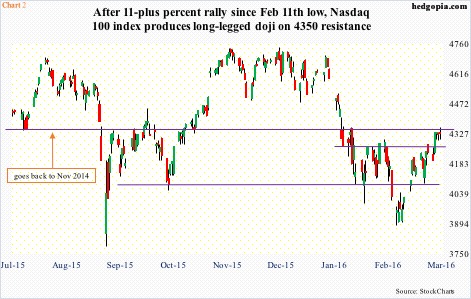
Here are the levels: Dow Industrials, 17000-plus; S&P 500, 1990; Nasdaq 100, 4350; Dow Transports, 7700; and Russell 2000, 1080.
Last Friday, post-jobs report, in the initial euphoria, all these hurdles were overcome, but the bulls were not able to hang on to the gains. Consequently, by close, the Dow Industrials (17001), Nasdaq 100 (4329), and the Transports (7652) slipped back below resistance, even as the Russell 2000 (1082) is literally sitting on it, and the S&P 500 (2000) slightly above.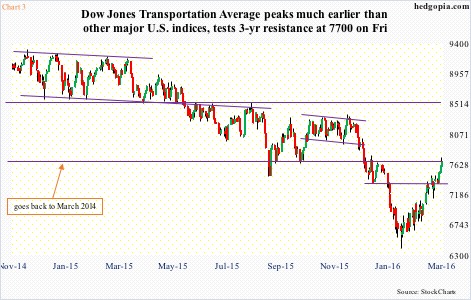
Focusing on the S&P 500, does Friday’s action qualify as a breakout? The price is above resistance for sure. That said, the day’s action smacked of at least some level of distribution, with a spinning top on resistance. This tends to be a neutral candle, but can signify a bearish reversal. So what happens in the next few sessions will be crucial. Similarly on the Nasdaq 100, a long-legged doji showed up.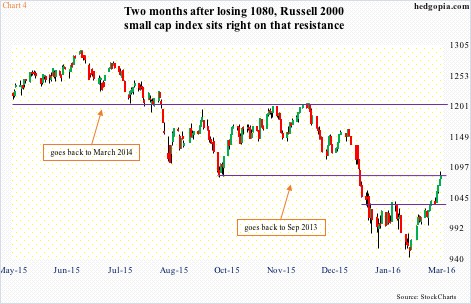
Here is one scenario. The S&P 500 continues on its merry way toward 2040, and then rolls over, confirming a big rounding top. That level is where the November 2015 trend line meets (arrow in Chart 1).
In this scenario, non-commercials’ net shorts in e-mini S&P 500 futures probably help. In the week ended last Tuesday, they cut holdings by eight percent, but at north of 191k contracts (Chart 5), there is plenty of room for it to go lower.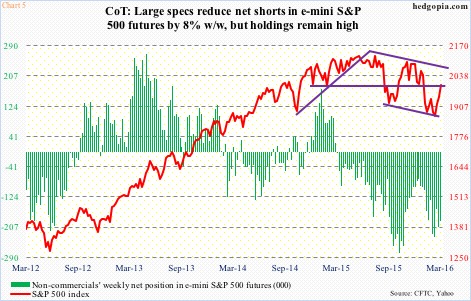
Early October last year, these traders had north of 278k contracts, which by mid-December were cut down to a little over 75k… this was such a tailwind for stocks.
This scenario would also enable both the green and red lines in Chart 6 to continue to unwind their overly extended conditions. In the chart, unlike the CBOE put-to-call ratio, the ISE index is a call-to-put ratio, hence inverted. Stocks do well when the green line declines, and/or the red line rises. They have been dropping/rising of late, but remain elevated versus history.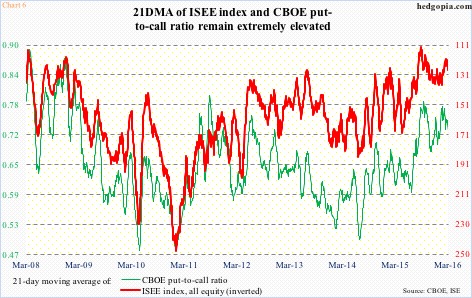
That said, in recent sessions there has been a sizable increase in investor/trader optimism. The CBOE put-to-call ratio has had readings of .50s and .60s for seven straight sessions, with the last two in .50s.
The fear-of-missing-out (FOMO) seems so intense that in no time at all stocks have gone from one extreme to another.
Take a look at Chart 7.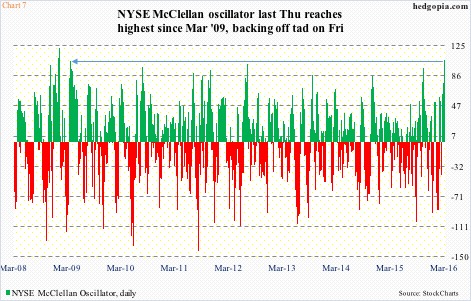
The NYSE McClellan oscillator reached -43.51 on February 11th – the day stocks bottomed – before turning. Turn it did. By last Thursday, this had spiked to 105.77, before dropping a tad on Friday to 104.19. That Thursday high was the highest since March 18, 2009.
And at Chart 8.
Once again, on February 11th, less than 20 percent of S&P 500 stocks were above their respective 50-day moving average. By Friday, this metric had risen to 83 percent. Sure, this can still push higher. In June 2003, this rose to a record 94.2 percent, before reversing. But, more often than not, once it reaches the 80s, stocks would have entered the danger zone. The current reading is the highest since 85 percent on December 29, 2014.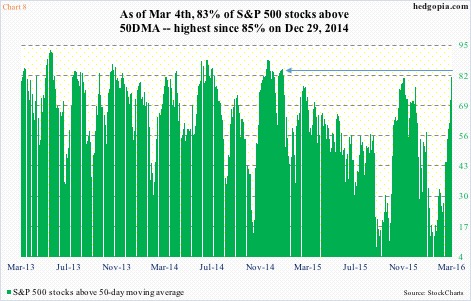
All this gives rise to a second scenario in which stocks begin to drop right here.
Technically, they are extended – way extended on a daily basis. They are at/near important resistance. And throughout this rally, flows never cooperated.
Since that February 11th low through last Thursday, SPY, the SPDR S&P 500 ETF, cumulatively lost $3.3 billion, QQQ, the PowerShares Nasdaq 100 ETF, $938 million, and IWM, the iShares Russell 2000 ETF, $476 million (courtesy of ETF.com).
Last Friday, spot VIX did something interesting – potentially a tell. It rallied along with the S&P 500. Not a whole lot – up just 0.16 (Chart 9). But the divergence with stocks came even as major indices were testing resistance. Besides, since February 11th spike reversal, spot VIX has shed 48 percent, losing both 50- and 200-day moving averages. But it refused to go down on Friday.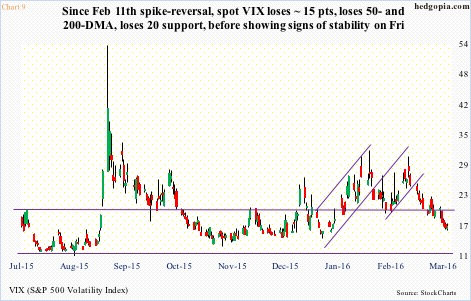
If the latter scenario pans out, bulls for sure hope these indices find support at recent breakouts and/or respective 50-day moving averages. Except for the Transports, the two are right next to each other.
On the S&P 500, for instance, they are 1950 (breakout retest) and 1938 (50-DMA). On other indices, they respectively are: Russell 2000 (1035 and 1040); Dow Transports (7360 and 7130); Nasdaq 100 (4270 and 4265); and Dow Industrials (16500 and 16527).
Importantly, positively for the bulls, 50-DMA is no longer dropping sharply. It is either slightly rising or flattish. Hence at this juncture it is their ball to lose, and a failure here would once again strengthen the bears’ case.
Thanks for reading!
