
Large-caps keep making new highs. Should small-caps, which currently sit at crucial juncture, manage to break out, risk-on sentiment can get a tailwind, driving several indicators – already extended – to dangerously extended territory.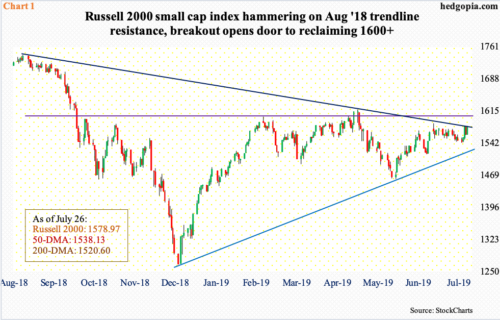
US equity indices keep making new highs – primarily large-caps. Both the S&P 500 large cap index and the Nasdaq 100 index rallied to new highs last Friday. The Dow Jones industrial average, however, is still a touch below its high from nine sessions ago. Mid- and small-caps, on the other hand, are severely lagging.
The S&P 400 mid cap index (1983.14) peaked last August at 2053.06, as did the S&P 600 small cap index (962.51) at 1100.58. Chart 1 uses the Russell 2000 small cap index (1578.97) to show small-cap action since that high. The index sits at crucial juncture right now.
A falling trend line from that high has consistently denied rally attempts, including early this month. This occurred again last week – not once, not twice, but three times. Down below, there is trend-line support from last December’s lows. A breakout opens the door to a test of major resistance just north of 1600, which has proven to be an important price point since January last year.
A takeout of both these levels has the potential to light a fire under risk-on sentiment. Currently, small-caps and transports are both lagging, even as large-caps are leading. This can be treated as non-confirmation. Incidentally, the Dow Jones transportation average, too, is sitting right below a trend line from last September. A breakout in small-caps and transports can further swing sentiment in bulls’ favor – duration notwithstanding.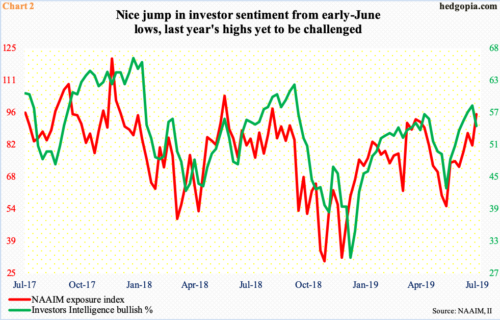
Investor sentiment is elevated but not excessively so.
Last week, Investors Intelligence bulls fell 3.8 percentage points week-over-week to 54.2 percent (Chart 2). Prior week’s 58 percent was the highest since 61.8 percent in early October last year. Similarly, the NAAIM exposure index last week jumped 13.9 points w/w to 95.75 – the highest since 98.30 in August last year. Equities back then were in a process of peaking before the rug was pulled out under them early October (Chart 1).
Viewed this way, there is room for these sentiment metrics to rise in the right circumstances, although sustaining it can prove difficult. The NAAIM index is not that far away from 100, and it is not often it achieves that milestone. Along the same lines, an Investors Intelligence bulls-to-bears ratio of four or above is rare; in the last four weeks, readings were north of three.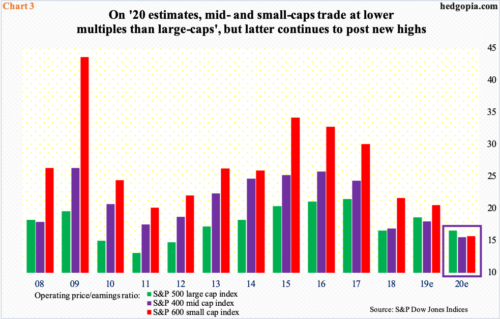
In a scenario in which bulls manage to hang in there and both small-caps and transports break out, multiple expansion continues. Not that multiples are cheap currently. But what is already expensive will get even more so.
Operating P/E for S&P 500/400/600 companies going back to 2008 is plotted in Chart 3 – trailing up to 2018 and forward after that. Multiples have been influenced by two factors – rising stock prices and persistently declining earnings estimates.
S&P 500 estimates for this year, for instance, went from $177.13 last August to last Thursday’s $162.65, and for next year from $186.36 in March this year to $182.56. The downward revision trend is no different for S&P 400 and 600 companies.
Here is the rub. If 2020 estimates come through, the S&P 500/400/600 respectively trades at 16.6x, 15.5x and 15.7x, which is not terribly expensive. But it is hard to trust these estimates, not only because the revision trend is decidedly down but also because of the growth rate it assumes. As things stand, earnings next year are expected to rise 12.2 percent, 16.1 percent and 30.5 percent, in that order. The economy is in its 11th year of recovery/expansion.
Be that as it may, this in and of itself should not stop momentum-driven traders from going overboard, if that is what ends up happening in the weeks and months ahead.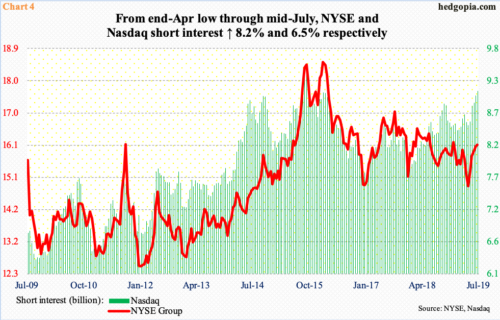
Ironically, in the right circumstances for bulls, bears could end up being a big help.
In a bifurcated world currently, from trade war to geopolitical tension to softening economy, there is no shortage of issues for bears to feed their bearish bias. Short interest hence remains elevated.
Mid-July, short interest on NYSE Group increased 0.3 period-over-period to 16.1 billion shares and on Nasdaq 0.8 percent to 9.1 billion. This was the fifth consecutive p/p increase in both. Since the end of April, short interest respectively has gone up by 8.2 percent and 6.5 percent, with NYSE’s at a six-and-a-half-month high and Nasdaq’s highest since October 2015. In a scenario in which indices continue to grind higher, short squeeze can self-fulfill.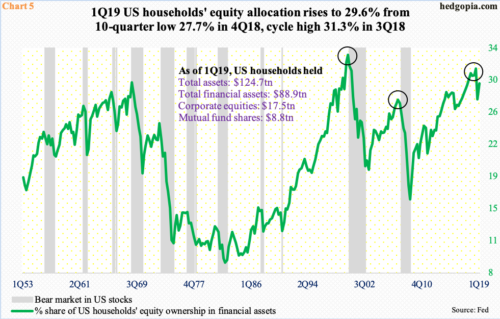
Of course, this would mean several indicators like the one portrayed in Chart 5 remain extended, or possibly push deeper into extended territory.
The chart shows US households’ equity allocation. In 1Q19, it increased 1.9 percentage points quarter-over-quarter to 29.6 percent. The cycle high of 31.3 percent was reached in 3Q18. The current reading is already higher than the high of the prior cycle, which was registered in 2Q07 at 27.7 percent. The all-time high of 32.9 percent was recorded in 1Q00.
A vicious bear market followed the prior two peaks. When the metric is as extended as is currently, the risk of a sharp reversal is always there.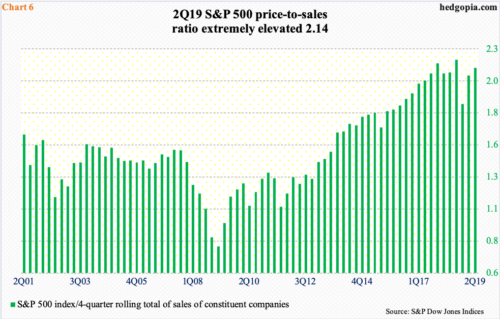
Or take Chart 6, for that matter. S&P 500 companies are expected to bring in $349.11 in sales per share in 2Q19, up 4.3 percent year-over-year. Growth has progressively decelerated from a year ago when the top line grew at a heady pace of 11.2 percent. Sales correlate strongly with nominal GDP, which too has softened.
The sales multiple, or the price-to-sales ratio, thus is a very useful tool as it is arrived at before taking into account earnings which can be managed. At 2.14, the ratio is in nosebleed territory currently. It peaked in 3Q18 at 2.20.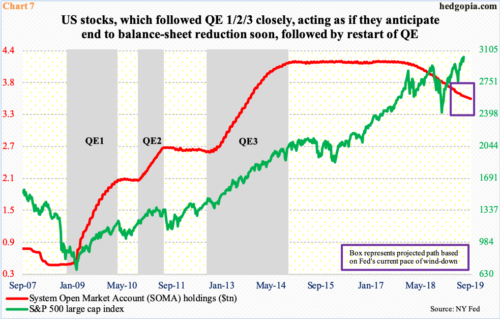
One of the reasons stocks have rallied particularly since the lows of last December is the Fed’s shift in bias from hawkish to dovish. In this week’s FOMC meeting, the fed funds rate will have been lowered by 25 basis points to a range of 200 to 225 basis points. This followed nine hikes of similar increments over four years through last December.
It is debatable if the Fed is in a position to lower rates right here and now. Macro data has softened, but several, including jobs and retail sales, have held up. Its conventional monetary quiver does not have sufficient arrows. But markets are demanding more stimulus. In the futures market, another cut in September is priced in, and maybe another in December. If the Fed yields to these demands, there will come a time when it has to sooner or later resort to unconventional policy.
Right now, the Fed is unwinding its balance sheet which was massively built up post-financial crisis. System Open Market Account (SOMA) holdings went from $500 billion in December 2008 to $4.24 trillion in April 2017. The bank began to run them down in October that year. The balance-sheet normalization program will end in September. Chart 7 shows a projected path of this wind-down in the next two months.
Stocks are behaving as if they not only expect a stop to the balance-sheet reduction but a restart of some sort of QE in the not too distant future. In the three iterations of QE post-crisis, stocks did very well.
Hence the importance of how small-caps behave in the near future. A breakout can set in motion a self-fulfilling prophecy. This at the same time could drive several metrics into overextended territory, which historically did not bode well for stocks.
Thanks for reading!
