
It is probably not coincidental that US stocks and Treasury yields peaked together early October. The 10-year rate is right near support and has room to rally near term. This should bode well for equity bulls who last week put their foot down.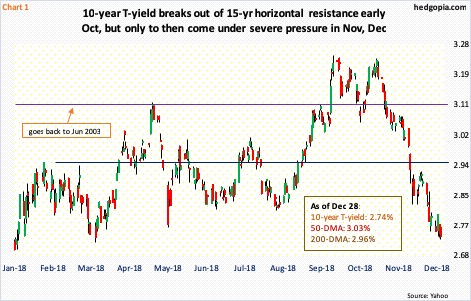
The 10-year T-rate hit 3.25 percent on October 5. The S&P 500 large cap index rose to its all-time high of 2940.91 on September 21 but did not begin its waterfall dive until October 3 when it came within 1.06 points of exceeding the September high.
Prior to reaching that early-October high, the 10-year rallied from 2.03 percent in September 2017, and particularly since July 2016 when it fell to record low 1.34 percent. On its way there, in April it broke out of 3.1 percent – an important level going back to June 2003 (Chart 1). The breakout also approximated a break out of a three-decade-old descending channel.
All along, the yield curve continued to flatten, as short rates followed the fed funds higher, but the long end refused to keep up. The yield spread between two- and 10-year notes fell as low as 11 basis points twice in the first half this month. The bond market is not too excited by prospects for the economy.
Between November 8 and the intraday low of 2.73 percent on December 28, the 10-year yield (2.74 percent) dropped 51 basis points. On the monthly, it is about to complete a potentially bearish MACD cross-under and is also at risk of losing a rising trend line from the July 2016 low. The daily, however, is deeply oversold. Support at the current level goes back to January this year. In the event of a rally, nearest resistance lies at 2.81 percent and after that 2.94 percent. The 200-day moving average rests at 2.96 percent.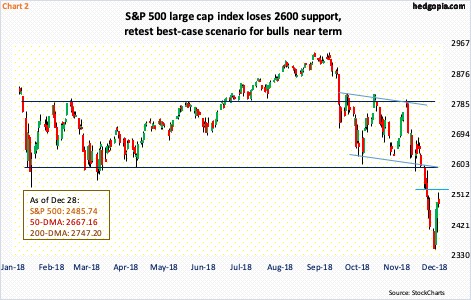
On the monthly, the S&P 500, too, has decidedly turned lower. In fact, several momentum indicators have reached the median. They can turn up from here or at least temporarily stop going down. Importantly, last week’s intraday low of 2346.58 tagged the 200-week moving average – successfully thus far. Through that low, the index lost 20.2 percent. And from that low, it has already rallied 5.9 percent. There is room for more.
Mid-December, the S&P 500 (2485.74) lost 2600 (Chart 2). Prior to this, for 10 months, it pretty much went back and forth between 2800 and 2600. A measured-move target of that box breakdown lies at 2400. Unless last Wednesday’s low is breached, a test of 2600 is the path of least resistance near term. How things evolve around that level will be telling.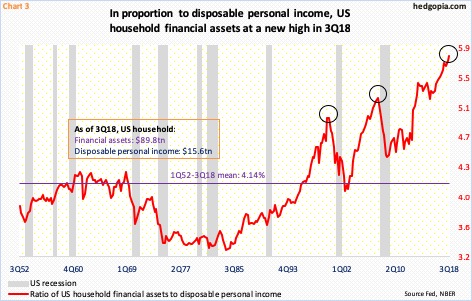
Medium- to long-term, the risk facing equity bulls is that several metrics such as shown in Chart 3 are in uncharted territory. Unwinding will not be pleasant.
In the chart, the ratio of US household financial assets to disposable personal income was a record high 5.77 in 3Q18. For reference, it peaked at five in 1Q00 and at 5.23 in 3Q07. The pace at which households’ financial assets was growing back then was unsustainable. Income was simply not keeping up. The current pace is even worse. Unwinding is a matter of ‘when’ not ‘if’. Once it begins in earnest, unwinding lasts for a while.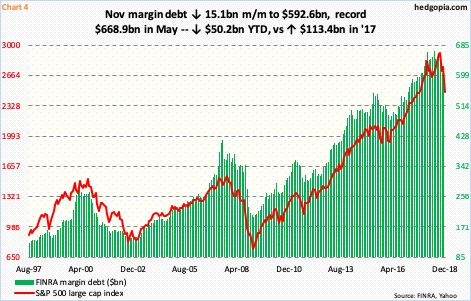
This would have come at a time when leverage remains high.
FINRA margin debt in November fell $15.1 billion month-over-month to $592.6 billion. This was less than the $40.5-billion m/m decline in October. However, the November drop came even though the S&P 500 rose 1.8 percent in that month, versus a 6.9-percent decline in October. December has been brutal. With one session to go, it is down 9.9 percent; in fact, it was down as much as 15 percent at one point. It will be interesting to see if reduction in leverage played a role in this.
Historically, as Chart 4 shows, the two tend to move together. In the current cycle, margin debt came under pressure after reaching a then-high of $665.7 billion in January this year. Later that month, the S&P 500 began a quick, double-digit decline (Chart 2). Come May, margin debt reached a new high of $668.9 billion, but only to then come under pressure. With 11 months in, it is down $50.2 billion this year; the S&P 500 is down seven percent. In 2017, margin debt surged $113.4 billion, and the S&P 500 jumped 19.4 percent.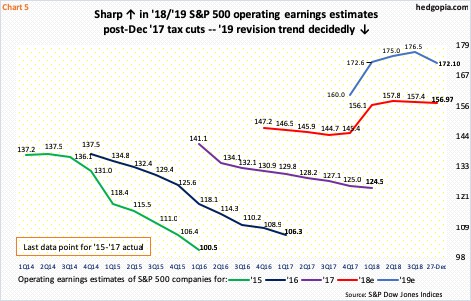
How earnings behave next year can impact how the green bars in Chart 4 behave. Operating earnings estimates for S&P 500 companies are being revised downward but remain elevated. As of last Thursday, they were $172.10. With one quarter to go, this year is expected to bring in $156.97.
Estimates for both this year and next shot up in the wake of corporate tax cuts of December last year. Early this year, 2019 estimates were $160.03. By August, they had shot up to $177.13, before reality began to sink in. Even after the persistent downward revision over the past five months, 2019 is expected to grow 9.6 percent. This would have come after a projected increase of 26.1 percent this year. Something is not right in this optimism. The October-December drop in stocks is a reflection of that.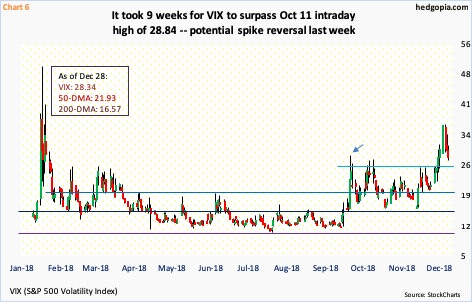
During the three-month rout, VIX (28.34) obviously rose, jumping to 36.20 intraday last Wednesday. This was the highest level since it spiked to 50.30 intraday in February this year. Using that as a yardstick, VIX is yet to rise to panicky levels – to 40s and 50s. At the same time, last week’s action also looks like a spike reversal, with a weekly gravestone doji. What transpires at 26-28 – particularly the lower bound – should decide how volatility behaves in the next few weeks.
On the daily, as well as the weekly, VIX has room to continue lower. In this scenario, the 21-day moving average of the CBOE equity-only put-to-call ratio has tons of unwinding left. The ratio closed out last week at 0.725, with last Monday’s 0.744 the highest since 0.764 in May 2016. In February that year, it rose as high as 0.771. In a perfect scenario for equity bulls, the ratio can drop to high-0.50s/low-0.60s.
This is also true with the VIX-to-VXV ratio, which on Monday last week closed at a very elevated 1.25, with Friday at 1.12. For the ratio to begin to unwind its overbought condition, VIX needs to lose premium faster than VXV. Equities should cherish this scenario.
As things stand, 2600 on the S&P 500 likely acts as a magnet near term.
Thanks for reading!
