The following are futures positions of non-commercials as of October 13, 2015. Change is week-over-week.
10-year note: Central bankers were probably busy scratching their heads this week. Despite trillions in quantitative easing and their valiant effort to push inflation above two percent, the latter keeps eluding them.
In September, consumer prices were unchanged in the U.S., after rising 0.2 percent in August. Core CPI rose 1.9 percent – ever closer to that elusive two-percent target. But the Fed prefers to focus on the core personal consumption expenditures price index, which only rose 1.3 percent in August; the last time it rose at two percent was back in April 2012. Producer prices are behaving much worse. Over the past year, they have fallen 1.1 percent.
Everywhere else we look, the story was the same in September. UK inflation (CPI) went negative, down 0.1 percent. China’s PPI fell 5.9 percent from a year ago. Japan’s PPI fell 3.9 percent from a year ago. And, wholesale prices in India fell 4.5 percent from a year ago.
It is worth noting that minutes of the September FOMC meeting seem to suggest that members are now focused more on inflation than on employment. Even in the latter, momentum is waning. Non-farm job openings in August dropped 298,000, to 5.37 million, while July was downwardly revised by 85,000.
Who can blame non-commercials for wanting to go net long 10-year note futures?
Currently net long 17.7k, up 20.2k.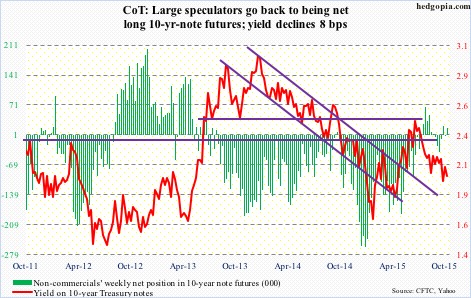
30-year bond: Next week is relatively light, but packed with housing-related data.
The NAHB housing market index for October is published on Monday. The September reading of 62 was the highest since 68 in October 2005.
This will be followed by housing starts for September on Tuesday. Of late, builders have been putting their money where their mouth is. Starts dropped month-over-month in July and August, to a seasonally adjusted annual rate of 1.13 million units, but momentum has been building. On a 12-month rolling average basis, starts have come in north of a million units for nine straight months.
September’s existing home sales are due out on Thursday. They fell 4.8 percent month-over-month in August, but July’s 5.58 million units (SAAR) were the highest since 5.79 million in February 2007. On a 12-month rolling average basis, August was 5.17 million units – the highest since 5.21 million units in November 2007. Once again, momentum is building. The only potential negative is how rapidly price has risen. The median price in August was $228,700, with month-over-month decrease the past couple of months from June’s highest ever of $236,300. Even higher than the bubble peak of $230,400 in July 2006. Yes, the median price is past the bubble high, although sales are nowhere near.
Next week, just one Federal Open Mouth Market Committee (FOMC) member is scheduled to speak during weekdays. Jeffery Lacker, president of the Richmond Fed, will speak on Monday. He is a strong hawk, having dissented in the September meeting. By the way, as per the Beige Book, two of the 12 districts – Richmond and Chicago – reported that the pace of growth slowed from mid-August until early October. Will there be a change in Mr. Lacker’s tone? Fingers crossed.
Currently net long 6.7k, up 13.9k.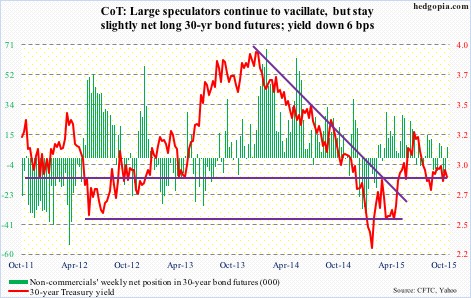
Crude oil: Did Qatar’s oil minister jinx it? Last weekend, he declared oil prices have bottomed out, with signs of a recovery in 2016. He said growth in non-OPEC oil supply slowed substantially this year and is likely to turn flat or negative in the next, adding low prices have caused oil companies to reduce their capex by almost 20 percent this year from $650 billion in 2014.
Spot West Texas Intermediate crude started the week by dropping 4.1 percent on Monday, in the process losing mini support at $47-plus, and kept dropping the next couple of sessions. The 50-day moving average ($44.83), which is no longer dropping, drew buyers in on Thursday.
There was some good news on the production front. In the week ended October 9, production declined 76,000 barrels a day, to 9.1 million barrels a day, essentially offsetting the increase last week. Production peaked at 9.61 mb/d in the June 5th week. As well, gasoline stocks fell 2.6 million barrels, to 221.3 million barrels – a three-week low.
On the other hand, crude inventory shot up 7.6 million barrels, to 468.6 million barrels – the highest since the June 5th peak (470.6 million barrels). As well, refinery utilization dropped 1.5 percentage points to 86 percent. Utilization has dropped 10.1 percentage points over the past couple of months.
Technically, spot WTI has come under pressure since its rally attempt was repelled by its 200-day moving average last Friday, producing a shooting star. Bulls did defend the 50-DMA this week.
Non-commercials continue to add to net longs.
Currently net long 297.9k, up 12k.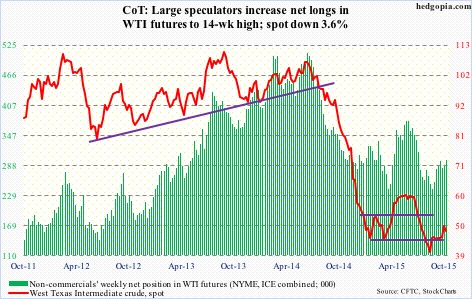
E-mini S&P 500: Something strange happened this week. Strange going by past standards. On Tuesday, Johnson & Johnson (JNJ), while reporting its September-quarter results, also announced a $10-billion buyback program, and the stock yawned. Then on Wednesday, Wal-Mart (WMT) forecast a 6-12 percent earnings drop in FY17, simultaneously authorizing a new $20-billion share repurchase program. Once again, investors focused on deteriorating fundamentals than on the allure of share buybacks.
Too soon to say if this is the beginning of a trend, but if it is, then it is coming at a wrong time. A common theme among companies reporting thus far has been continued pressure on the top line, although bottom-line estimates get met. Share buybacks, cost-cutting measures, etc. have helped the bottom line. Hopefully for the bulls, this is not a massive shift in sentiment.
This is important as flows are yet to perk up. Investors poured $2.5 billion into U.S.-based stock mutual funds and ETFs in the week ended Wednesday (courtesy of Lipper). Last week, there were $8 billion in outflows. The rally continues to struggle to excite buyers.
However, that is not the impression we get if we just focus on the improved price action.
The S&P 500 has managed to rally all the way up to just underneath broken support at 2040-2050. A convincing break here has the potential to squeeze the shorts big time, but for that to happen, flows need to improve.
Non-commercials cut back net shorts a little, but are staying with massive holdings.
Currently net short 244.4k, down 33.8k.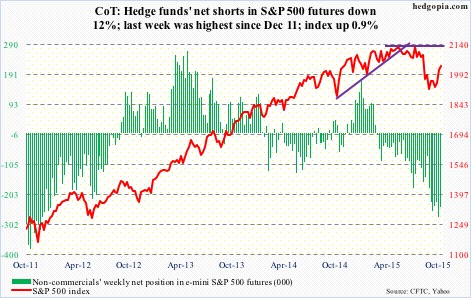
Euro: Industrial production in the Eurozone dropped 0.5 percent in August. As well, the ZEW survey (German economic sentiment) fell to 1.9 points in October from 12.1 in September. The Volkswagen scandal probably played a role. But the real story has probably to do with sluggish global growth. China imports collapsed just north of 20 percent in September.
Next Thursday, the ECB meets. It is difficult to imagine the bank announcing an outright extension of its current €60-billion/month stimulus program, but it will be interesting if Mario Draghi, ECB president, will drop a wink and a nod. Or, even better will be to watch how the euro reacts – either way. The currency continues to test the ECB’s will. It rallied 12 percent in less than six months before beginning to come under pressure in late August. All the while, Mr. Draghi has been saying the bank is ready to adjust the asset-purchase program, if the need be.
Currently net short 80.6k, down 8.2k.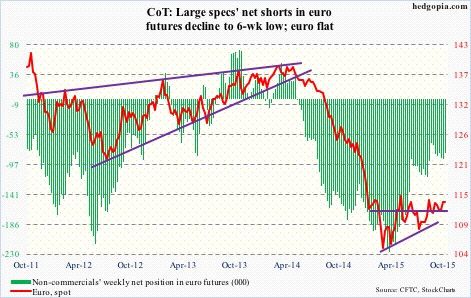
Gold: The metal rose on Monday and on Tuesday, and shot up 1.7 percent on Wednesday reacting to the lousy U.S. retail sales data for September and the weak PPI. Gold has been showing improved price action for a while now. From July 24th low to Thursday’s high, GLD, the SPDR Gold ETF, rallied 10 percent.
But the question is, can the momentum continue? Probably not near-term. It is in need of a rest. Daily technicals are grossly overbought, with both Thursday and Friday producing signs of distribution. The Wednesday action pushed the ETF above its 200-day moving average, but was not able to hold on to it. This is occurring right underneath resistance – both declining trend line and horizontal line.
With that said, as gold was rallying, it took care of resistance at $1,140, which can now provide support. Plus, the 50-day moving average ($1,132.33) is curling up. Medium- to long-term, there is reason to be optimistic, just not near-term.
Non-commercials disagree, having raised net longs to a 21-week high.
Currently net long 117.2k, up 30.3k.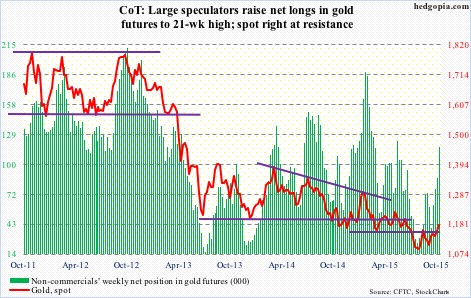
Nasdaq 100 index (mini): The index has rallied past 4350, which has been an important price point going back to last November. Semis helped big time. The latter caught fire this week, with SMH, the Market Vectors semi ETF, rising 2.9 percent. No, semis did not rally on visible improvement in fundamentals, rather on M&A rumors. If we are to trust press reports, Sandisk (SNDK) has hired a banker to find a buyer. Analog Devices (ADI) is supposedly in merger talks with Maxim Integrated (MXIM). And last but not the least, since Intel (INTC) acquired Altera, rival Xilinx (XLNX) is apparently in play. That is the thinking behind the semi rally. We shall see.
The bigger question is, what would Apple (AAPL) deliver when it reports (on the 27th)? The stock does not act well.
Currently net long 11.8k, up 2.2k.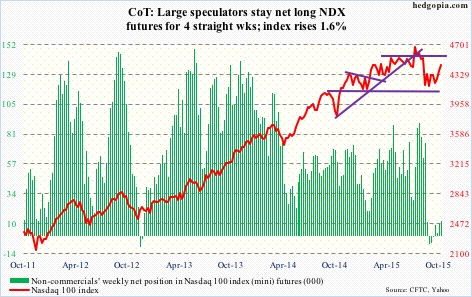
Russell 2000 mini-index: Last week, the Russell 2000 rallied 4.6 percent for the week, raising hopes that risk-on was back on the table. As well, high-yield bond funds attracted $1.5 billion during the week ended this Wednesday (courtesy of Lipper).
Not so fast. This week, the Russell 2000 was a laggard, down 0.3 percent versus up 0.9 percent for the S&P 500, up 1.2 percent for the Nasdaq composite, and up 0.8 percent for the Dow Industrials.
Turns out the options market read it well. As of Friday last week, in the October 16th expiration the amount of put open interest on IWM, the iShares Russell 2000 ETF, heavily outweighed call open interest.
Currently net short 40.5k, down 2.6k.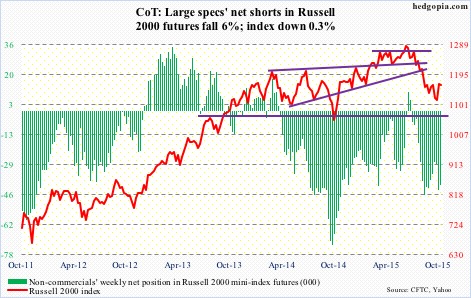
US Dollar Index: The game of blaming the dollar for weak results continues. Several companies did exactly that this week. Even the Beige Book took a note of it. A weak currency helps, but ultimately supply-demand dynamics need to be favorable.
In the U.S., end-demand is tepid, plus inventories are rising. The Fed is in a box. And a dollar index that rallied 25 percent in nine months through March needs interest rates to move up, which is not happening. Non-commercials continue to cut back net longs.
For the week, the index lost 0.3 percent, but closed substantially off the lows. It has lost both its 50- and 200-day moving averages, but has room to rally near-term.
Currently net long 38.9k, down 7.1k.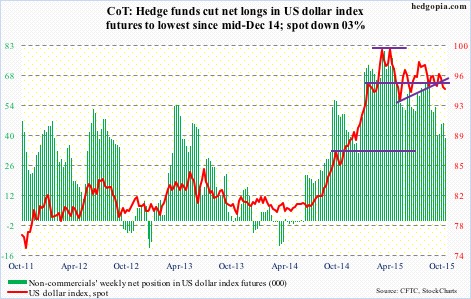
VIX: Spot VIX keeps deflating, now down 70 percent from the August 24th intra-day high of 53.29. In the meantime, the ratio of VIX to VXV, which measures three-month volatility on the S&P 500 (VIX serves the same purpose but only goes out a month), has dropped to the low 0.80s from the August 24th intra-day high of 1.3. The ratio is at a level from where it has rallied in the past. For it go lower still, spot VIX needs to break support at 15.
Currently net long 15.6k, down 5.4k.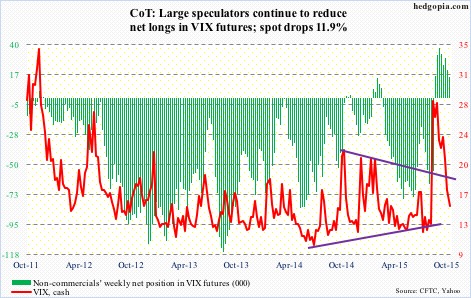
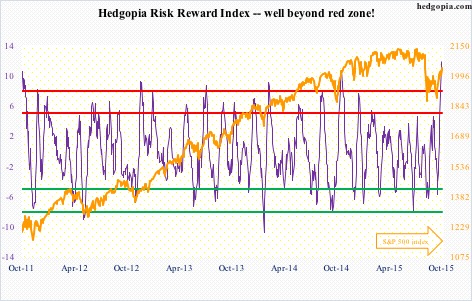
Hedgopia Risk Reward Index