The following are futures positions of non-commercials as of November 3, 2015. Change is week-over-week.
10-year note: Three prominent Fed officials tried to convince the markets this week that December was in play in earnest.
Testifying before the House Financial Services Committee on Wednesday, Janet Yellen, Fed chair, said “December would be a live possibility” for first rate increase. Later that day, Mr. Dudley, president of the New York Fed, described December as a “live possibility.” Later in the evening, Stanley Fischer, Fed vice chair, said the Fed may quickly meet its two-percent target once the price of oil stabilizes and the dollar stops rising – the implication being he is comfortable moving now although inflation is below their target.
Of course, they all qualified their statements by as Mr. Dudley put it “but let’s see what the data shows.”
Data have spoken – at least the ones the “data dependent” Fed is focused on. October showed non-farm job gains of 271,000, unemployment rate of five percent, and 2.5-percent year-over-year increase in average hourly earnings of private-sector employees – at the highest pace since July 2009.
Pre-jobs report, two-year Treasury bills were already yielding 0.85 percent on Thursday – matching the highs of April 2011 – breaking out of nine-month resistance at 0.74 percent. Friday, it shot up to 0.9 percent.
Thus far, the long end of the curve is tagging along, with 10-year yields rising 18 basis points and 30-year yields up 16 basis points for the week. The long end is not panicking just yet, though the curve did flatten a bit. Should the long end begin to falter, that will be a warning sign – the bond market essentially saying the economy is not in a position to handle higher rates – as there are tons of reasons for the Fed to not move.
Now that the genie is out of the bottle, the only excuse for not moving in December is if stocks take a tumble into the December 15th-16th FOMC meeting or the November jobs report is a big disappointment.
Non-commercials are beginning to bet a hike is coming in December. Net shorts rose to the highest since early May.
Currently net short 164.3k, up 128.6k.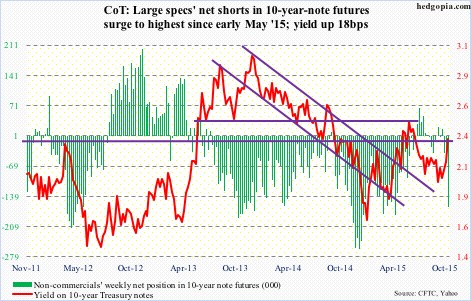
30-year bond: Next week’s major economic releases are as follows.
Tuesday, the National Federation of Independent Business publishes its optimism index for October. September was 96.1, up from 95.9 in August. But it peaked last December at 100.4, which was the highest since October 2006. At 16, small businesses’ comp plans were the highest since 17 in December.
Thursday, the JOLTS report for September comes out. August saw a drop in non-farm job openings from 5.67 million in July to 5.37 million. July was also revised lower from 5.75 million.
Friday, we have retail sales for October, the University of Michigan’s consumer sentiment index for November, and October’s PPI-FD.
Retail sales are still growing year-over-year, but growth has decelerated quite a bit. In September, they grew 2.4 percent, and were growing at 4.9 percent in August last year.
The final reading of consumer sentiment in October was 90, up from 87.2 in September. Sentiment has been under pressure since reaching 98.1 in January this year.
Producer prices in September fell 0.5 percent – the biggest decline in eight months. In the 12 months through September, the PPI fell 1.1 percent. Core PPI fell 0.3 percent in September month-over-month and rose 0.5 percent in the 12 months through September. Not much pricing pressure for producers.
Six FOMC members are scheduled to speak on weekdays. Last week, there were eight.
Currently net short 21.9k, up 1.7k.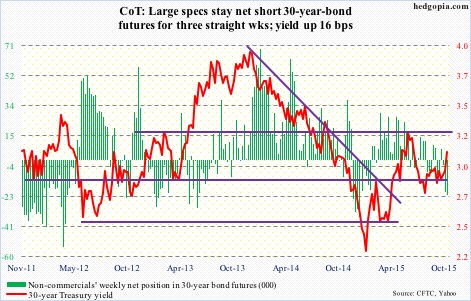
Crude oil: The $47-$48 resistance proved too tough to crack after all. On both Tuesday and Wednesday, spot West Texas Intermediate crude attacked that level, only to get repelled. What next? Support at $43 in play again?
On Wednesday in particular, oil bulls were disappointed with news on crude inventory.
For the week ended October 30th, stocks of crude oil rose by 2.8 million barrels, to 482.8 million barrels – the highest since the May 8th week. This was the sixth straight weekly increase.
Crude production, too, rose by 48,000 barrels a day, to 9.16 million barrels a day – a four-week high. Production peaked at 9.61 mb/d in the June 5th week.
On other fronts, news was not all that bad.
Refinery utilization rose further, to 88.7 percent. It has now risen 2.7 percentage points since October 9th. Utilization peaked at 96.1 percent in the August 7th week…Gasoline inventory fell by 3.3 million barrels, to 215.3 million barrels – an eight-week low…Distillate stocks dropped 1.3 million barrels, to 140.8 million barrels – a 17-week low…Crude imports fell further, by 89,000 barrels a day, to 6.9 mb/d – the lowest since the June 19th week.
With the four-percent drop this week, the WTI also lost its 50-day moving average, still rising but likely to now provide resistance. The lower Bollinger band lies at $43-plus, which also corresponds to two-month support. Let us see if buyers show up near that support.
Non-commercials are not giving up.
Currently net long 263.1k, up 23.4k.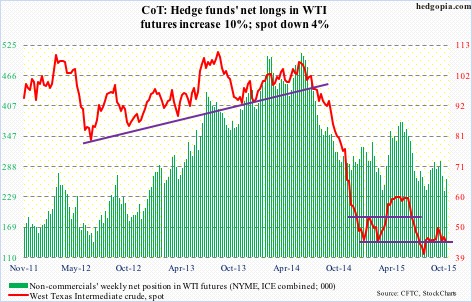
E-mini S&P 500: U.S.-based equity funds attracted $5.7 billion more in the week ended Wednesday (courtesy of Lipper). With this, since the week ended September 30th, cumulative inflows have totaled $12 billion.
Equity bulls should also take heart from the fact that this is money willing to buy at progressively higher multiples.
Right before the S&P 500 index collapsed by 11 percent in five sessions back in August, 3Q15 operating earnings estimates of S&P 500 companies stood at $28.93. The index was trading at 19.5x trailing 12-month earnings back then. These estimates have now been chopped further down to $24.93; the index on Friday traded at 20.3x.
Money that left back then using valuation as an excuse is not going to get in now. Earnings are dropping and stocks are rising. Not a healthy combo.
That said, as long as flows continue, multiples will expand.
Near-term, the S&P 500 looks vulnerable. Important sectors such as consumer discretionary are giving out signs of fatigue.
Support is galore – 200-day moving average (2063), 2040, 2020, 50-day moving average (1997). If these levels attract new money, wanting to get in to benefit from favorable seasonality, then shorts may be in for more pain. Short interest remains high, and has already provided a big tailwind for stocks since the September 29th low.
Currently net short 157.6k, down 8.4k.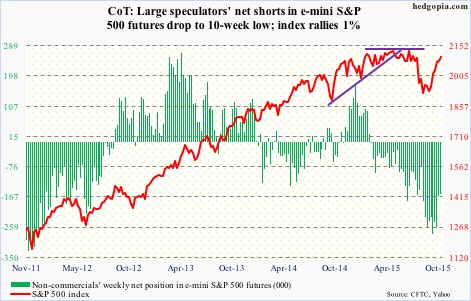
Euro: Markit’s final Eurozone PMI reading for October came in at 53.9, weaker than a prior estimate of 54 but up from September’s four-month low of 53.6. It has been above the 50 mark since July 2013.
Prices in the region were flat year-on-year in October. The good news is that prices are not dropping. The bad news is that the ECB has a two-percent target.
So is October’s inflation reading enough to nudge Mario Draghi, ECB president, and his team toward adding more stimulus come December? The bank has been buying €60 billion in assets every month, and that program runs through next September.
Two weeks ago, post-governing council meeting, Mr. Draghi dropped strong hints of possible announcement of additional stimulus in December. Then last week, he seemed to be backpedaling a little bit.
Since that meeting until Thursday, the euro dropped four percent. If jawboning is having this kind of an effect, why act? Come Friday, it dropped another 1.3 percent. The spike in U.S. rates and prospects of disadvantageous interest rate differential is hurting the euro. Five-month support at 108-plus is now gone. Momentum is down at the moment. The low in March this year was 104.62.
Currently net short 134.3k, up 28.4k.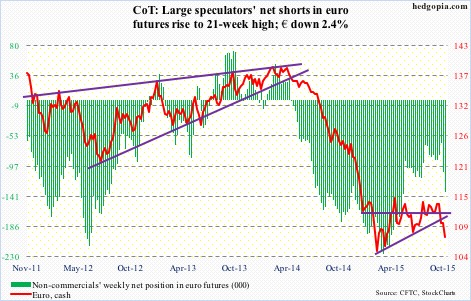
Gold: Since spot gold failed at 1,180-plus resistance four weeks ago, it has been all downhill. The metal has now been down for three consecutive weeks, with eight straight daily declines.
The daily chart looks grossly oversold, hence a bounce is always possible, but on a weekly basis there is room for it to go lower still.
Leading up to – and even during – the latest sell-off in gold, non-commercials have been aggressively buying. Last week, their net longs were the highest since February this year. Enough in enough. This week, they pull in their horns.
Currently net long 116.3k, down 41.1k.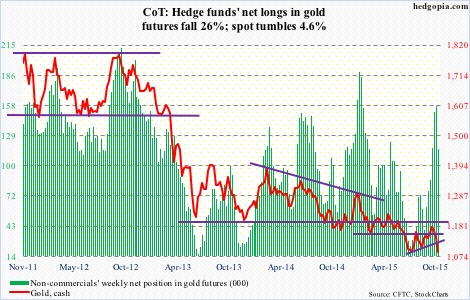
Nasdaq 100 index (mini): The Nasdaq 100, which is capitalization-weighted, notched a new all-time high, up 1.3 percent for the week. Its top-five holdings all rallied more than the index – AAPL (13 percent weight) up 1.7 percent, MSFT (7.4 percent weight) up 4.3 percent, AMZN (5.1 percent weight) up 5.4 percent, GOOGL (4.5 percent weight) up 3.3 percent, and FB (4.3 percent weight) up five percent.
That is the story of the ongoing rally. Money continues to gravitate toward large-caps. Non-commercials have been on the right side of trade.
Currently net long 70.1k, up 13.3k.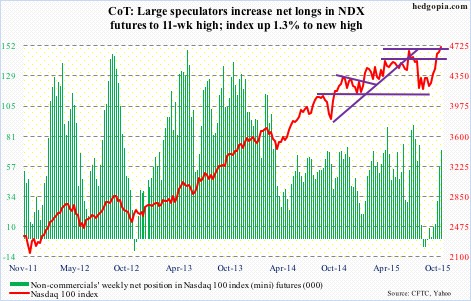
Russell 2000 mini-index: Last week, the Russell 2000 broke out of resistance at 1170, only to drop back below it the very next session. This week, bulls were at it again, and succeeded. A couple of things need consideration in this regard.
With the move this week, the index is sitting right underneath the daily upper Bollinger band. Daily conditions are way overbought. And last but not the least, there is massive resistance at 1210-ish, which goes back to March last year.
Near-term, the best bulls can hope for is this. The index retreats, and finds support at 1170. This week, buyers showed up near that level on both Thursday and Friday. If this is lost, then there is the 50-day moving average, which is turning up.
Currently net short 41.7k, up 243.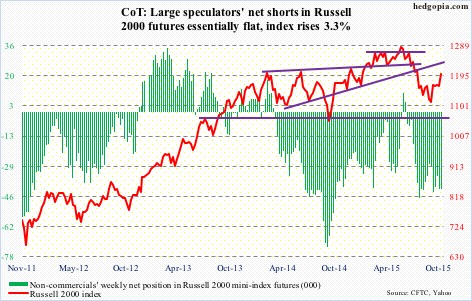
US Dollar Index: Coming into the week, the dollar index was overbought on a daily basis, but had room to rally on a weekly chart. The latter prevailed. The index tacked on another 2.3 percent this week. Friday alone produced a 1.2-percent gain.
With this, the index is now past six-month resistance at 98-plus.
Is it a fundamental shift in sentiment? Probably not. At least not know. The index is riding the coattails of the spike in two-year yields.
If it is a genuine change in sentiment, it is not evident in how non-commercials are positioning themselves. At least not yet. That said, we would not know until the next CoT report how these traders reacted to Friday’s jobs numbers.
Should sentiment shift to the bullish side, God help U.S. multinationals and U.S. exports. And U.S. corporate earnings. Operating earnings estimates of S&P 500 companies for next year have been coming down but at $126.94 the dollar and a whole host of other things will need to cooperate before they are realized.
Currently net long 39.9k, up 5.2k.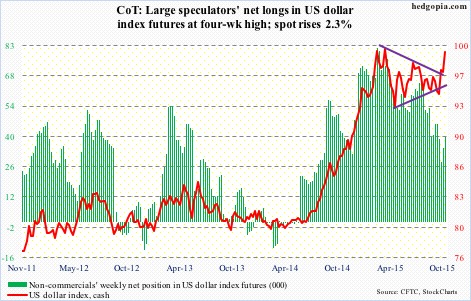
VIX: On Tuesday, spot VIX had a bullish MACD crossover, but is struggling to gain traction. For most of nearly a month now, it has hugged its 200-day moving average, which repelled a rally attempt on Thursday, and again on Friday.
If there is any solace for volatility bulls, shorter-term daily averages are flat to slightly rising. The Bollinger band continues to tighten.
Currently net short 3.7k, up 3.5k.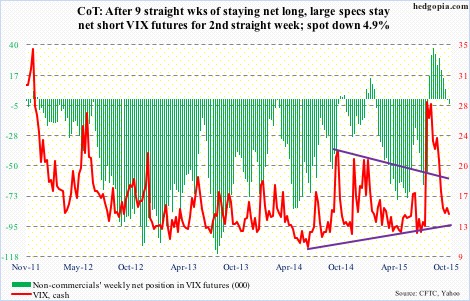
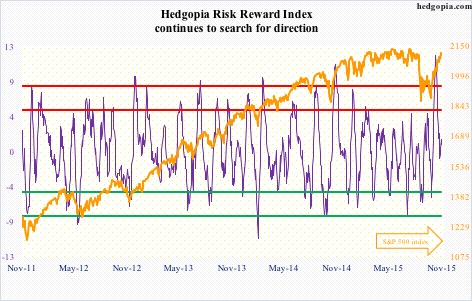
Hedgopia Risk Reward Index