The following are futures positions of non-commercials as of January 26, 2016. Change is week-over-week.
10-year note: Two important developments took place this week in central banking.
First, the Fed. This week’s FOMC meeting was a non-event. No interest-rate decision was expected. At the same time, given the rout in stocks globally as soon as the year began, markets were hoping the Fed would dial back its rate-hike projection this year. It did not oblige.
Is the so-called Yellen put still good? Or is the message ‘we have done enough, now you are on your own?’
The FOMC statement did drop the median estimate for the normal rate of unemployment to 4.9 percent from a previous range of 5.2 percent to 5.5 percent. By doing so, it may be opening up the door to wait to hike rates, should the need be. As well, risks were no longer viewed as “balanced.” One can argue the Fed thinks recent global developments has increased downside risks for growth expectations.
Tough to say. The statement was as vague as can be. It did not signal a March hike was imminent, but did not explicitly suggest it was off the table either, which is what markets were hoping for. Now the wait begins for Ms. Yellen’s February 10th semi-annual Congressional testimony for hopefully clearer signals.
Secondly, the Bank of Japan, in a five-to-four vote, lowered its target interest rate by 20 basis points to minus 0.1 percent. It was a surprise move, but Haruhiko Kuroda, BoJ governor, is probably not thrilled by markets’ reaction. On Friday, stocks were up, down and up again. The initial 3.1-percent euphoria was gone within 28 minutes, followed by a drop of as much as 1.6 percent, before making a comeback and ending up 2.8 percent. This is not how it is supposed to happen. Markets should have embraced this wholeheartedly and gone full risk-on right from the word go.
Hence the question, are central banks pushing on a string and no longer getting the desired effect of their activism? Even worrisome, are markets beginning to conclude that central banks are pushing on a string? That would be a worrisome development.
For now, non-commercials rightly bet that rates were headed lower, with the 10-year losing 12 basis points.
Currently net long 44.5k, up 112.3k.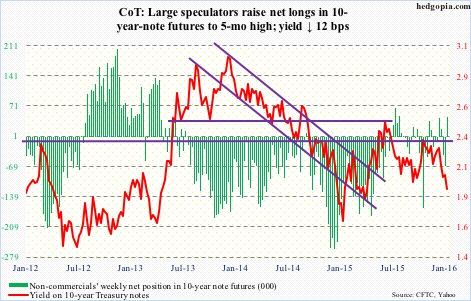
30-year bond: Major economic releases next week are as follows.
Personal income and spending data for December is due out on Monday. The core PCE price index – the Fed’s favorite measure of inflation – rose a mere 1.33 percent in November annually. The last time it increased at two percent was in April 2012. That said, it has been inching higher since 1.26-percent increase in July last year, which was the lowest since March 2011.
Also on Monday, we get ISM manufacturing index for December. It has been sub-50 for two consecutive months, the first time this has happened since July 2009. The new orders index, too, was under 50 in both November and December – the first such occurrence since May 2013.
The ISM non-manufacturing index comes out on Wednesday. It is still in expansion mode. The last time it dipped below 50 was in July 2009.
Preliminary productivity numbers for the fourth quarter will be published on Thursday. In 3Q15, non-farm output per hour increased 2.2 percent, revised up from previously reported 1.6 percent. Unit labor costs were revised up as well, rising 1.8 percent instead of previously reported 1.4 percent. The upward revision to productivity was smaller than a one-percentage point upward revision to hourly compensation growth.
Thursday also brings the full report on durable goods for December. The advance report came out this Thursday, and it was ugly. Orders for non-defense capital goods ex-aircraft were down 7.5 percent year-over-year – the sharpest decline since November 2009.
Friday is January’s employment report. Non-farm jobs momentum picked up steam in the fourth quarter, with monthly average gains of 284,000, much stronger than 2015 average of 221,000. Recent strength in job creation is yet to positively impact wages. The average hourly earnings of private-sector employees rose 2.5 percent annually in December. The last time the metric grew with a three handle was in April 2009.
Currently net long 4.4k, up 10.2k.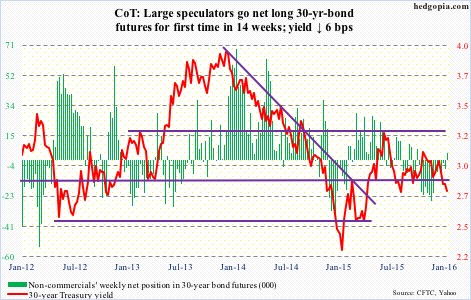
Crude oil: The EIA report for the week of January 22nd was mixed at best and bearish at worst.
Crude production dropped by 14,000 barrels per day, to 9.22 million barrels per day. Last week was a 21-week high. Production peaked at 9.61 mbpd in the June 5th week.
Crude imports fell by 170,000 bpd, to 7.61 mbpd. In the past couple of weeks, imports have dropped by 579,000 mbpd.
Distillate stocks declined by 4.1 million barrels, to 160.5 million barrels. Two weeks ago, stocks (165.6 million barrels) were the highest since the January 21, 2011 week.
Now on to the negatives:
Refinery utilization fell by 3.2 percentage points, to 87.4 – a 14-week low. Utilization peaked at 96.1 percent in the August 7th week.
Gasoline stocks increased by 3.5 million barrels, to 248.5 million barrels. This was the 11th straight weekly increase, and at the highest since the March 2, 1990 week.
Even worse, crude stocks increased by 8.4 million barrels, to 494.9 million barrels – the highest ever (data goes back to 1982).
Spot West Texas Intermediate crude went on to rally 4.3 percent in the week. It was part fatigue – fatigue of going down – and part rumors of possible Russian willingness to discuss output cutbacks.
Later on Friday, talking to Bloomberg, Russian energy minister said Russia would participate in talks with both OPEC and non-OPEC nations that Venezuela has proposed for February. But there is no date and no confirmed meeting yet.
Saudi Arabia, by the way, continues to say it would continue to maintain its capital expenditures.
The Russians and the Saudis do not trust each other, with the former thinking the Saudis are in cahoots with the Americans and are out to get them. So we will see what comes out of these rumors.
For now, between the January 20th low and the 28th high, spot West Texas Intermediate crude rallied 26 percent. On Thursday, it rallied up to 34.82, before pulling back. Friday produced a doji. Getting past this resistance will be a sign the bulls are making progress. They have a tough task at hand.
Non-commercials continued to add this week, though ever so slightly. Two weeks ago, holdings were at the lowest since July 2012.
Currently net long 210.9k, up 17.5k.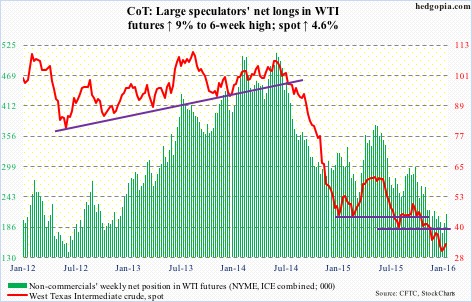
E-mini S&P 500: As of Wednesday, another $1.2 billion came out of U.S.-based equity funds (courtesy of Lipper). Year-to-date, outflows have now totaled north of $27 billion. Since September 30th, $36 billion has left.
This pretty much explains the 5.1-percent decline in the S&P 500 in January (was down as much as 11.3 percent at one point).
That said, there are some signs of buying interest. For the week ended Thursday, $1.9 billion moved into SPY, the SPDR S&P 500 ETF (courtesy of ETF.com). The ETF rose 1.7 percent for the week.
The path of least resistance on the S&P 500 continues to be 1990.
Shorts obviously have done well, and as of mid-January were not rushing to cover. Rather, on both the NYSE and Nasdaq, as well as several leading ETFs, short interest rose in the latest period – potential recipe for mini squeeze. We probably saw some of that on Friday.
Non-commercials, too, had raised net shorts to a 13-week high last week, and cut those down by 30 percent this week.
Currently net short 131.9k, down 56.7k.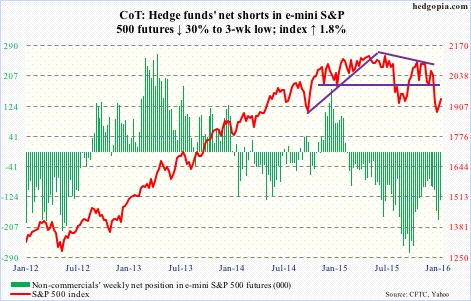
Euro: Euro-area consumer prices rose an annual 0.4 percent in January, after rising 0.2 percent last month. This was the biggest increase since October 2014.
That said, the five-year, five-year forward inflation-swap rate is at its lowest since January last year. In the meantime, in Germany the Ifo Institute’s business-climate index fell for a second month in January.
Mixed signals, and the currency reflects that.
On December 3rd, the euro rallied 3.1 percent, rising intra-day to 109.80. Markets decided Mario Draghi, ECB president, failed to live up to expectations of dovish action/message. Since then, that high, besides a brief breach, has held the currency back. The BoJ move was no help on Friday, with the currency losing one percent.
Non-commercials continue to cut back net shorts – now at a 13-week low.
Currently net short 127.2k, down 9.8k.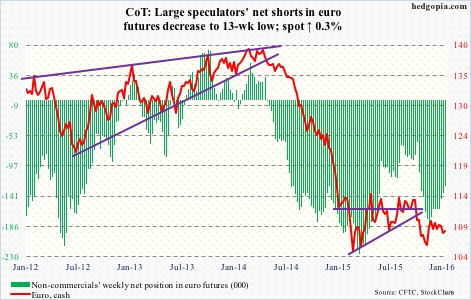
Gold: The metal finally saw some bidding – up 1.8 percent for the week.
The rally off of the 50-day moving average since the middle of the month brought spot gold to the upper Bollinger Band, as well as to just under the 200-day moving average. Daily conditions are overbought. This could be a perfect spot for the metal to digest the recent gains.
On the way down, 1,080 is a must-hold… which, by the way, also approximates 50-DMA, which is now curling up.
Currently net long 59k, up 15.3k.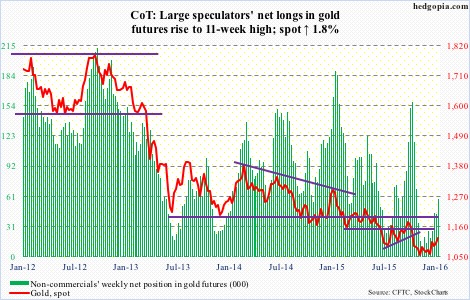
Nasdaq 100 index (mini): It was only up 0.5 percent for the week, substantially underperforming its peers. Apple (AAPL) and Amazon (AMZN) are the primary culprits – down four percent and 1.6 percent, respectively.
Apple (AAPL), with a 11-percent weighting in the Nasdaq 100 and a relative underperformer for a while, has been hurting the index. Post-CY4Q15 earnings, the stock lost 6.6 percent on Wednesday. Once the apple of investors’ eye, Apple suffers from too big a reliance on iPhones.
In the just concluded quarter, iPhones comprised 63 percent of total revenue. The company sold 74.78 million phones. Gargantuan on an absolute basis, but growth is stalling, up a mere one percent year-over-year.
AAPL’s March-quarter revenue guidance of $50 to $53 billion would represent the first quarterly drop since 2003. Even more worrisome, this is what Tim Cook, CEO, said: “We began to see some signs of economic softness in Greater China earlier this month, most notably in Hong Kong.”
Despite AAPL-induced Wednesday sell-off, the Nasdaq 100 is trying to repair damage, with two back-to-back weekly hammers. In an ideal scenario near-term, it has a shot at 4350.
That said, non-commercials are lukewarm to these prospects.
Currently net long 30.3k, up 1.2k.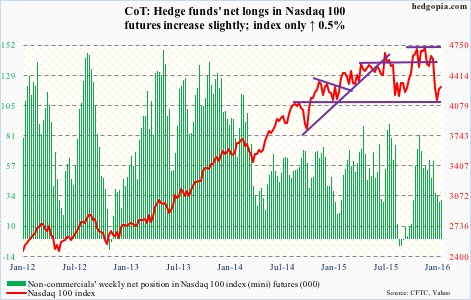
Russell 2000 mini-index: In the week ended Thursday, $1.4 billion moved into IWM, the iShares Russell 2000 ETF (courtesy of ETF.com).
As is the case with the Nasdaq 100, damage repair is in progress. As things stand, the best the bulls can hope for is a move toward 1080.
Two weeks ago, non-commercials had the highest net longs since October 2014. They have since cut those down by 11 percent. If bulls can get their act together, there is room for squeeze.
Currently net short 48.7k, down 6.1k.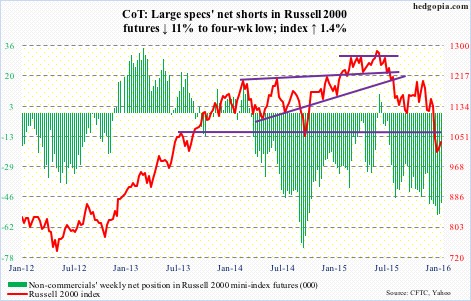
US Dollar Index: In March and November last year, the US dollar index rallied just north of 100, only to retreat. This level is now important technically.
Prior to the BoJ action, the index looked to be wanting to go lower, with the 50-day moving average pointing lower and weekly momentum indicators weakening.
Friday, on the coattails of the BoJ action, the dollar index rallied one percent, but still not enough to push it past the afore-mentioned resistance.
Once again, judging by non-commercials’ holdings, no breakout is imminent. They have been grudgingly adding to net longs the past five weeks… holdings pale in comparison to what they had leading to the March high last year.
Currently net long 44.2k, up 1.5k.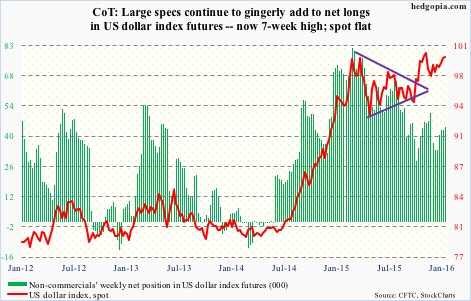
VIX: For the first time since August 25th, non-commercials went net long last week. This week, they added.
If past is prelude, non-commercials shifting from net short to net long coincides with a peak in the spot. So far, this is precisely how things have unfolded.
If there is a spot for volatility bulls to put their foot down, this is it. The spot (20.20) is sitting at support, which also approximates its 50-day moving average.
Currently net long 14.2k, up 4.7k.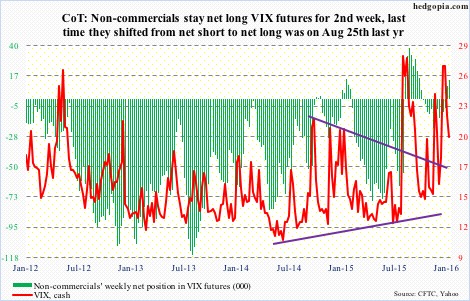
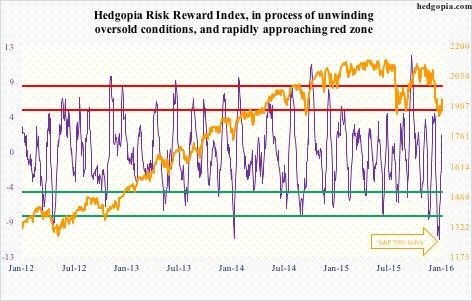
Hedgopia Risk Reward Index