The following are futures positions of non-commercials as of February 16, 2016. Change is week-over-week.
10-year note: Global GDP will only expand at three percent this year. Says the OECD – the latest body to cut growth forecast this year. Back in November last year, it was predicting 3.3 percent growth. Its latest forecast is lower than the IMF’s forecast a month ago of 3.4 percent growth this year.
Back then, the IMF expected the U.S. economy to grow at 2.6 percent this year. The OECD expects growth of two percent, which by the way is lower than the 2.3 percent currently expected by Wall Street consensus.
Translation: Things are decelerating.
Minutes of the FOMC’s Jan 26-27 meeting released Wednesday stated/suggested as much. Members judged that the fall in commodity prices and the rout in financial markets had increased uncertainty for the U.S. economy.
Sounds like they are looking for a reason to dialing back their earlier four-hikes-this-year dot-plot projection.
Last week, chair Janet Yellen told Congress that monetary policy was by no means on a preset course. This was followed by comments on Wednesday from James Bullard, the St. Louis Fed president, a voting member, that it would be unwise for the Fed to continue hiking interest rates given declining inflation expectations and recent equity market volatility.
There you have it.
Four quarter-point hikes this year were just a pipe dream to begin with. Deteriorating data – both markets- and fundamentals-driven – is providing the FOMC a cover.
Currently net short 40.3k, down 22k.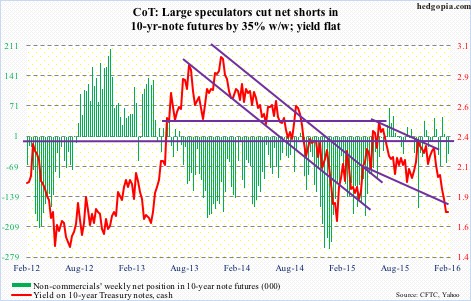
30-year bond: Major economic releases next week are as follows.
The S&P Case-Shiller home price index for December comes out on Tuesday. November saw a year-over-year rise of 5.3 percent nationally. Prices have been rising in the four to five percent range since July 2014. The last time they grew with a three handle was in September 2012.
Also on Tuesday, January’s existing home sales are due out. December rose 14.7 percent month-over-month to a seasonally adjusted annual rate of 5.46 million units, but that was after a 10.5-percent decline in November. Sales reached 5.58 million last July – the highest since 5.79 million in February 2007.
January’s new home sales will be published on Wednesday. December was up 10.8 percent to a SAAR of 544,000 units – essentially on par with 545,000 last February, which were the highest since 593,000 in February 2008.
On Thursday, the advance report on durable goods for January is scheduled for release. Orders for non-defense capital goods ex-aircraft fell 4.3 percent m/m in December to a SAAR of $66 billion. Orders peaked in September 2014 at $74 billion, and have been down year-over-year for 11 straight months.
On Friday, we get GDP (4Q15 second estimate); personal income (January), and the University of Michigan’s consumer sentiment (final February report).
Real GDP decelerated to growth of 0.7 percent in 4Q15 from two percent in 3Q15. Things seem to be snapping back, though. As of February 17th, the Atlanta Fed’s GDPNow model is forecasting 2.6-percent growth in the first quarter.
In the personal income report, all eyes will be focused on core PCE inflation – the Fed’s favorite measure of inflation. In December, it increased at 1.41 percent y/y. This is still below the Fed’s two percent goal. That said, it has been trending up since 1.26 percent last July. Interestingly, core CPI has risen north of two percent y/y for three straight months now.
February’s preliminary reading of consumer sentiment showed a dip of 1.3 percentage points m/m to 90.7. Sentiment peaked in January 2015 at 98.1. That was an 11-year high.
Four Fed officials have public appearances scheduled during weekdays.
Currently net long 13.5k, up 15.4k.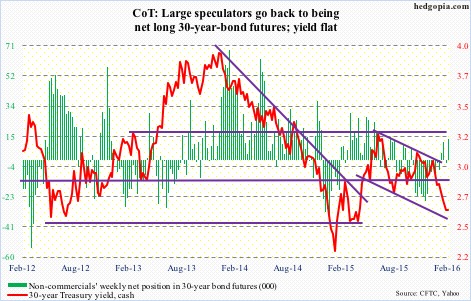
Crude oil: Saudi Arabia, an OPEC member, and Russia (non-OPEC) agreed on Tuesday to freeze crude production at January levels. Qatar and Venezuela (both OPEC) are tagging along. The wildcard Iran remains uncommitted, as is Iraq (both OPEC).
It is a step in the right direction, but it is worth remembering that it is a freeze, not a cut. In a glut situation, a freeze does not help much.
It is this supply-demand imbalance that Deloitte points out that nearly 35 percent of publicly traded oil and gas E&P (exploration & production) companies around the world – about 175 firms – are at high risk of falling into bankruptcy.
For the week ended February 12th, U.S. supply just got worse.
Crude stocks jumped 1.2 million barrels, to a new record 504.1 million barrels. In the past six weeks, inventory has gone up by nearly 22 million barrels!
Gasoline stocks rose by another three million barrels, to 258.7 million barrels – yet another record (data goes back to 1990). This was the 14th straight weekly increase.
Distillate stocks rose by 1.4 million barrels, to 162.4 million barrels. Five weeks ago, stocks (165.6 million barrels) were the highest since the January 21, 2011 week.
As well, crude imports rose by 795,000 barrels per day, to 7.9 million barrels per day.
Here are some positives.
Refinery utilization rose by 2.2 percent, to 88.3 – the first weekly increase in seven weeks. The prior week was a 17-week low. Utilization peaked at 96.1 percent in the August 7th (2015) week.
Crude production dropped by 51,000 barrels per day, to 9.14 mb/d – a 16-week low. Production peaked at 9.61 mb/d in the June 5th (2015) week.
Amidst all this, spot West Texas Intermediate crude hung in there. On January 20th, it made an intra-day low of $27.56. In the next six sessions, it rallied 26 percent. That rally predictably stopped just south of $35. Resistance at $34.50-$35 is heavy.
Once again this Thursday, sellers showed up just north of $34 – just outside the 50-day moving average, which is trying very hard to go flat.
The path of least resistance near-term is down. Non-commercials are not showing much faith in the rally. Net longs have been cut to the lowest since June 2012.
Currently net long 152.8k, down 50.9k.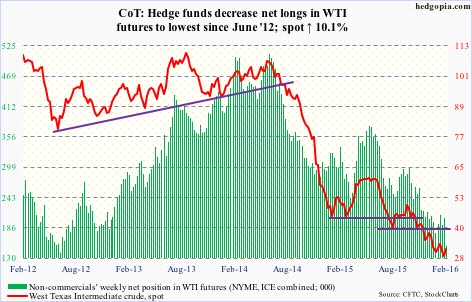
E-mini S&P 500: In the week ended Wednesday, the S&P 500 rallied 4.1 percent. That was not enough to entice new money. Rather, outflows continued.
The trend is intact – the trend of withdrawals. Stocks go down, money leaves. Stocks go up, money leaves still. This has been more or less going on since late September last year when stocks bottomed. Cumulatively, nearly $50 billion has left U.S.-based equity funds since September 30th (courtesy of Lipper).
Not surprisingly, the withdrawal pace has picked up speed since 2016 started. A total $41 billion has been withdrawn in the past seven weeks alone.
That said, kudos to bulls for having pulled off a rather sharp rally off of 1800 support. Encouragingly for them, resistance at 1880 was conquered, and 10- and 20-day moving averages are beginning to hook up. If flows cooperated, this would be a perfect time to build on these positive developments. But they have not. Until that changes, it is hard to trust the sustaining power behind this rally.
In the week ended Thursday, SPY, the SPDR S&P 500 ETF, shed $1.3 billion – versus the $5.9 billion it took in the prior week (courtesy of ETF.com).
Currently net short 158.8k, down 75.5k.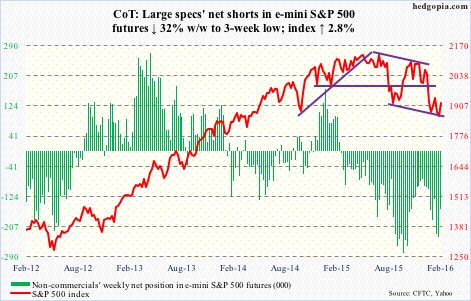
Euro: In the nine weeks through February 11th the euro rallied nearly eight percent. It is currently in the process of digesting those gains. Support at 111 is being tested. This level also approximates the 200-day moving average (110.64).
If this support gives away, weekly momentum indicators may take over. They remain overbought. The currency just had a daily MACD bearish crossover. That said, that average was defended on Friday.
A weaker euro may help pacify ECB officials who continue to nag about low inflation in the Eurozone. This week, Jan Smets, a governing council member and head of the National Bank of Belgium, said if Eurozone inflation remains at its current zero level it could lead to a new recession. He is probably laying the groundwork for further easing at the next meeting on March 10th.
Same old, same old. Debtors trying to ignite inflation to lessen the burden of debt.
Non-commercials’ continue to reduce net shorts – now lowest since June 2014.
Currently net short 48.2k, down 15.1k.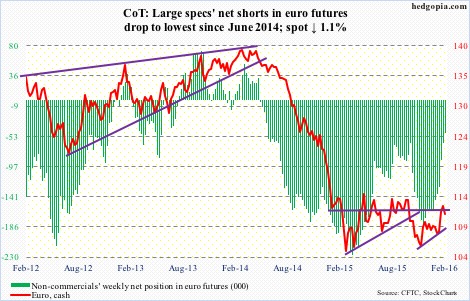
Gold: The metal started the week weak, but found support on its 10-day moving average. This was expected. That average is still rising, and after the sharp rally spot gold has experienced of late, gold bugs were supposed to defend that average, and they have.
On Tuesday, the metal dropped to 1191.5, before rallying, so not sure this qualifies as breakout retest. The 1180 level has been an important price point going back to November 2009, and the spot just broke out of it.
The metal’s problem near-term is that it remains overbought on a daily chart, and now on a weekly chart as well. Also, GVZ, gold’s volatility, last week spiked past 30 – only the ninth time this has happened in its six-year history. In the past, these spikes marked peaks in the price.
On a positive note, spot gold’s 50-day moving average started going flat a month ago, and is now rising. Even the 200-day moving average is no longer dropping – kind of flattish. Thus far, money continues to pour in. In the week ended Wednesday, $333 million moved into GLD, the SPDR Gold ETF (courtesy of ETF.com).
Non-commercials’ net longs were at a 16-week high. However, this was not enough to push up the price. The spot shed one percent. Some signs of distribution are showing up.
Currently net long 117.4k, up 18.9k.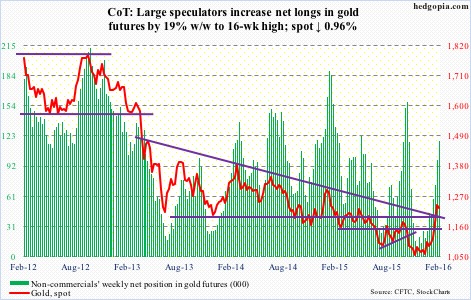
Nasdaq 100 index (mini): The good: Shorter-term moving averages are no longer dropping, rather flattish.
The bad: In rallying eight-plus percent intra-day between February 8th low and February 18th high, lots of buying power have been spent. In fact, in the week ended Thursday, $367 million left QQQ, the PowerShares Nasdaq 100 ETF.
And the ugly: If the index manages to rally to 4300-4350, it is probably an aggressive short near-term. The 50-day moving average lies at 4333. In all probability, it begins to come under renewed pressure before it gets there.
Non-commercials just went net short – first time in five months.
Currently net short 369, down 10k.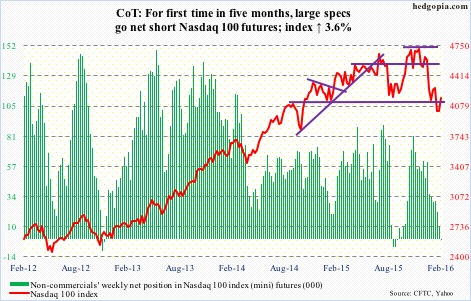
Russell 2000 mini-index: In the week ended Thursday, $814 million left IWM, the iShares Russell 2000 ETF (courtesy of ETF.com). Another example of money leaving on strength.
Currently net short 51.2k, up 1.7k.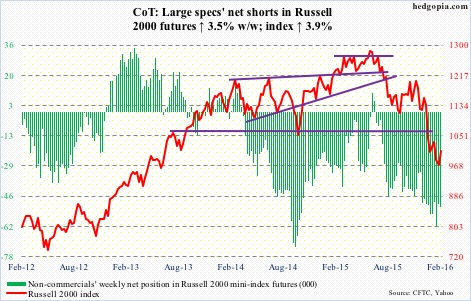
US Dollar Index: Off the February 11th intra-day low through Friday’s high, the spot rallied 2.1 percent in five sessions – hugging its 200-day moving average in the past four.
Dollar bulls have so far been unable to push through resistance at 97. Technically, there is room, as oversold daily momentum indicators have unwinding left still. It needs a fundamental push. The dismal exports news out of both China and Japan was not enough. In January, Japan exports fell 9.1 percent year-over-year, and China’s dropped 11.2 percent.
Non-commercials continue to cut back net longs – now at 17-week low.
Currently net long 31.3k, down 3.7k.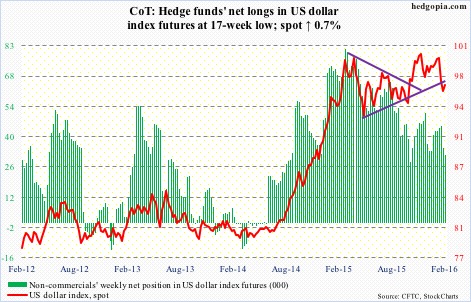
VIX: Last week’s spike-reversal signal was spot-on. Spot VIX lost 19 percent for the week. With this drop, it has now lost the 50-day moving average. In a worse-case scenario, the 200-day moving average (18.24) could be in play.
Last week on Thursday, using intra-day highs, the VIX-to-VXV ratio spiked to 1.05. This was preceded by a similar intra-day reading of 1.11 in the prior week. This week, the ratio closed at 0.9. Ideally, if equity bulls had their way, the ratio has room to go lower – toward high 70s to low 80s).
Currently net long 26.7k, up 7k.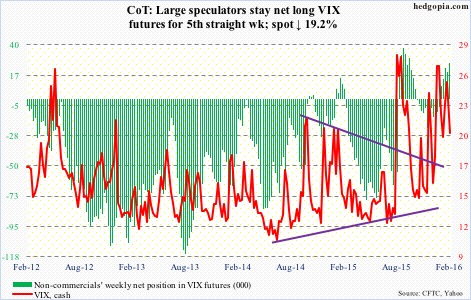
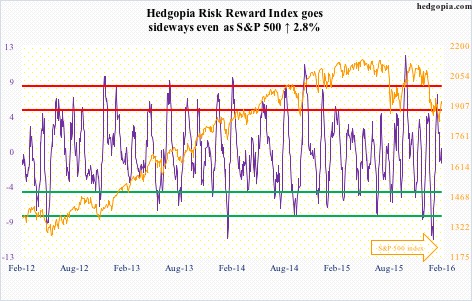
Hedgopia Risk Reward Index