The following are futures positions of non-commercials as of March 8, 2016. Change is week-over-week.
10-year note: The FOMC meets next week, and it is a given. They will stand pat on interest rate, but the dot plot likely sees a change in rate forecast. In the middle of December, members forecasted four rate hikes this year.
A lot has happened since, not to mention the January rout in stocks, and with that a change in some members’ policy bias. James Bullard, president of the St. Louis Fed, for instance, now leans dovish. Loretta Mester, president of the Cleveland Fed, on the other hand, is sticking with her hawkish stance.
In the end, this is reason enough for the FOMC statement, due Wednesday, to strike a balanced language, reiterating data dependency.
Most revealing would be their inflation comments – how they are viewing the recent uptrend in both core PCE and CPI, up 1.7 percent and 2.2 percent year-over-year in January. Early this week, Stanley Fischer, Fed vice-chair, brought up the topic in a speech, saying we may well at present be seeing the first stirrings of an increase in the inflation rate.
Currently net long 68.1k, up 65.5k.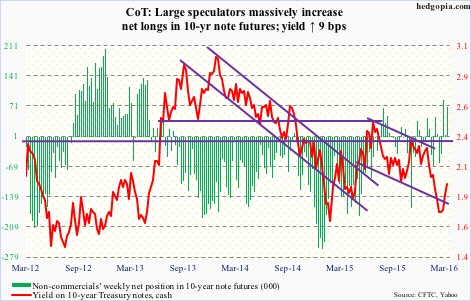
30-year bond: Major economic releases next week are as follows. It is a data-heavy week.
On Tuesday, FOMC meeting begins, and concludes the next day. A post-meeting press conference is scheduled for Janet Yellen, chair.
Also on Tuesday, we get PPI-FD and retail sales for February; NAHB housing market index for March, and Treasury International Capital data for January.
Producer prices inched up 0.1 percent in January. In the 12 months through January, the PPI fell 0.2 percent. Core PPI rose 0.2 percent and 0.8 percent, respectively.
Retail sales rose 0.2 percent month-over-month in January to a seasonally adjusted $449.9 billion. This was the fourth straight monthly rise. Y/y, sales rose 3.4 percent – the highest growth rate in the past year.
In December, the 12-month rolling average of net foreign purchases of U.S. equities reached minus $125.7 billion – a record. The last time this metric was positive was in October 2013.
The NAHB housing market index fell three points m/m in January to 58. The cycle high 65 was reached last October – a 10-year high.
Wednesday brings CPI, housing starts, and industrial production for February.
Consumer prices were unchanged in January. In the 12 months through January, prices rose 1.4 percent. Core CPI rose 0.3 percent and 2.2 percent, respectively, with the latter rising the most since June 2012.
Housing starts fell 3.8 percent m/m in January to 1.1 million units (SAAR) – down from 1.2 million last September. On a 12-month rolling average basis, however, January’s 1.11 million was the highest since 1.13 million in June 2008.
Capacity utilization inched up 0.9 percent m/m in January to 77.1 percent. This was the first m/m increase in six months. However, y/y, utilization has now decreased for nine straight months. The cycle peaked at 79 percent in November 2014.
January’s JOLTS comes out on Thursday. Job openings were up 261,000 m/m in December to 5.61 million, but were nearly flat with 5.67 million last July.
On Friday, the University of Michigan’s consumer sentiment survey is published. This will be preliminary data for March. February was down three-tenths of a percent m/m to 91.7 percent. The cycle peaked at 98.1 in January last year – an 11-year high.
Currently net long 36.9k, up 12.8k.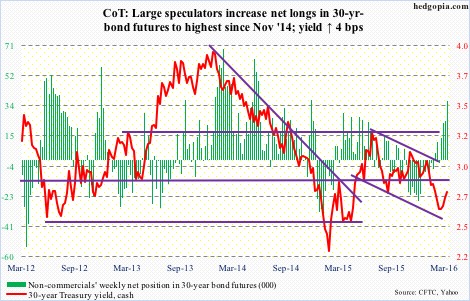
Crude oil: Spot West Texas Intermediate crude further built this week on the breakout last Friday (out of $34.50 resistance).
At this juncture, markets are focusing on gasoline stocks and crude production, and less on crude inventory.
In the week ended March 4th, crude stocks rose by another 3.9 million barrels to 521.9 million barrels – a new record! Stocks have gone up by nearly 40 million barrels in the past nine weeks.
Gasoline stocks, however, are seeing some improvement, down 4.5 million barrels to 250.5 million barrels. They are now down 8.2 million barrels from the record high three weeks ago.
Similarly, crude production rose by a thousand barrels per day to 9.1 mb/d, but has declined by 157,000 b/d in the past seven weeks. Production reached a record 9.61 mb/d in the June 5th (2015) week.
There was some good news in crude imports as well, which fell by 244,000 b/d to 8.05 mb/d. Distillate stocks fell by 1.1 million barrels to 162.5 million barrels. And last but not the least, refinery utilization rose eight-tenths of a percent to 89.1, which is now up three percentage points in the past month.
Markets clearly are focused on the positives, not negatives.
The 50-day moving average on spot WTI continues to flatten out, with the crude currently right at resistance. The next one at $40 is right above.
Two weeks ago, WTI futures saw the largest week-over-week increase in non-commercials’ net longs since October 2010. And they continue to add.
Currently net long 234.2k, up 16.2k.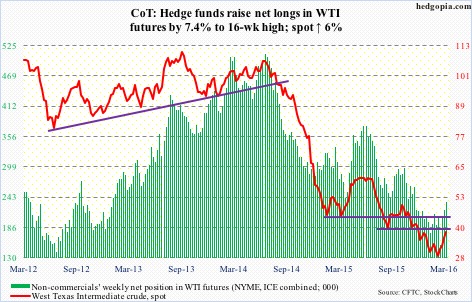
E-mini S&P 500: At long last! For the first time this year – in 10 weeks – U.S.-based equity funds saw some inflows. A healthy $4.6 billion in the week ended Wednesday (courtesy of Lipper). Year-to-date, however, outflows still total nearly $42 billion.
Bulls for sure hope this is the beginning of a trend. After all, money-market funds have been rising since the middle of last year, with the four-week average at $2.8 trillion. Plenty of dry powder out there, provided it finds a home in stocks.
Before the bulls pop champagne, here is some not so encouraging news.
The latest weekly inflows were not much help to stocks; the S&P 500 was flat in that week.
That said, in the week ended Thursday, $458 million ($1.7 billion on Thursday) moved into SPY, the SPDR S&P 500 ETF (courtesy of ETF.com). Friday, the index broke out.
It has now taken care of 1990 resistance and is sitting on the 200-day moving average. There is gap resistance at 2040, which is where the November 2015 declining trend line converges as well.
Currently net short 205.7k, up 14.2k.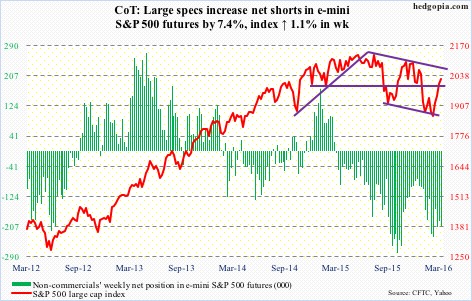
Euro: Mario Draghi, ECB president, pulled out his big bazooka on Thursday but it misfired.
First the ‘shock and awe’ decision. All interest rates were cut. The existing QE has been expanded from €60-billion/month in purchases to €80 billion. And the surprise of all! The bank will now buy corporate debt! Good heavens! Are things really that bad?
Initially on Thursday, post-decision, the euro fell hard, equities rallied. But investor mood soured in no time. By close, the DAX was down 2.3 percent; from intra-day high to low, it collapsed five percent. The euro, down 1.6 percent, shed 3.7 percent from the session high.
Equities recovered Friday, with the DAX rallying 3.5 percent. But the euro would only give back 0.3 percent.
So why the Thursday reaction?
Markets wanted Mr. Draghi to deliver, and he did. But has he gone all in? Is that how markets are reading this? He did say he does not anticipate more rate cuts based on current view. That is one way to look at this. Here is another.
In one year, the ECB went from buying government debt to corporate debt. What next? Junk debt? Stocks? In desperation, the bank can easily expand its monthly program from €80 billion to €100 billion, for example. Or do any other monetary experiment. As long as markets do not rebel.
There would come a time when markets will start puking at all these unconventional monetary measures that have persistently failed to yield the desired results. Arguably, we may have seen early signs of it on March 10th.
Currently net short 71.9k, up 3.4k.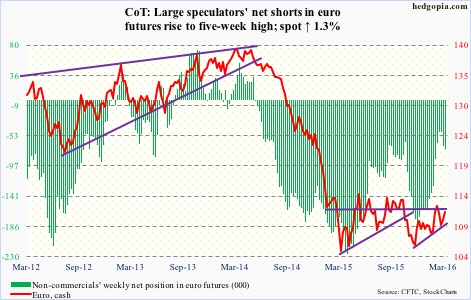
Gold: Spot gold lost 0.7 percent in the week, and continues to give out signs of fatigue.
In the week ended Thursday, another $229 million moved into GLD, the SPDR gold ETF (courtesy of ETF.com). Since December 3rd when gold bottomed, the ETF has attracted nearly $6 billion.
Plus, non-commercials have taken their net longs from under 10k contracts to nearly 175k – now at 11-month high.
Despite extremely overbought daily conditions, gold bugs refuse to give up. On Thursday, buyers once again stepped in to defend the ascending-triangle breakout; the session low approximated the 20-day moving average.
But, once again, the metal looks tired. It lost the 10-day moving average on Friday. The next one to go would be the 20, which is going flat. The week produced another long-legged doji – second in three weeks.
Currently net long 174.8k, up 22.4k.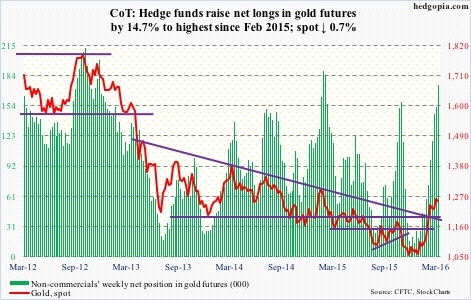
Nasdaq 100 index (mini): Closed the week at 4362, past resistance at 4350. Does it qualify for a breakout? Probably not. It is not as clean as on the S&P 500.
From the bulls’ perspective, the good thing is that on Thursday the 50-day moving average was defended in another long-legged doji session. They must also be hoping that this would help improve flows into QQQ, the PowerShares Nasdaq 1000 ETF. In the week ended Thursday, it attracted $110 million.
Non-commercials, however, are not waxing enthusiastic.
Currently net long 6.8k, down 7.1k.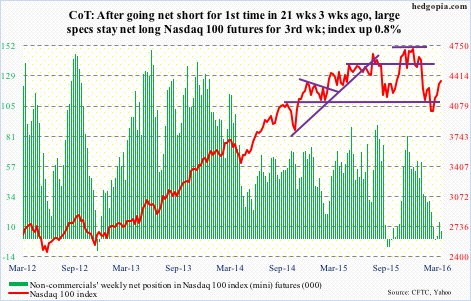
Russell 2000 mini-index: As is the case with the Nasdaq 100, the Russell 2000 is past resistance – at 1080. But it is a feeble breakout.
Unlike the past couple of weeks, the index underperformed its major U.S. peers this week. This, despite the $460 million that moved into IWM, the iShares Russell 2000 ETF, in the week ended Thursday (courtesy of ETF.com).
Non-commercials raised net shorts to a 17-month high.
Currently net short 66.1k, up 4.9k.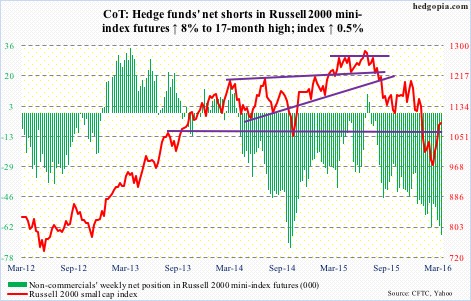
US Dollar Index: Not surprisingly in a whiplash session on Thursday, from intra-day high to low, the dollar index lost 2.4 percent, ultimately finding support on a slightly rising trend line drawn from May 2015. It is trying to stabilize near the daily lower Bollinger Band.
The spot has now lost both 50- and 200-day moving averages. The former incidentally is dropping, and the latter flattish. If there is no improvement in the next several sessions, for whatever it is worth, a death cross likely completes in the not too distant future.
Non-commercials show absolute no interest in adding to net longs.
Currently net long 26.4k, down 407.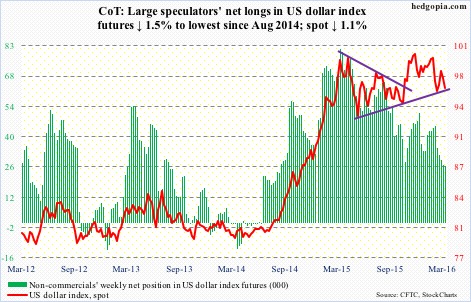
VIX: Spot VIX potentially is in the process of carving out a bottom on a daily chart. The only question is if the process needs more time or is already in motion.
Encouragingly for volatility bulls, the August 2015 rising trend line is providing support. As long as this holds, the bottoming process continues.
Currently net long 21.1k, down 2.2k.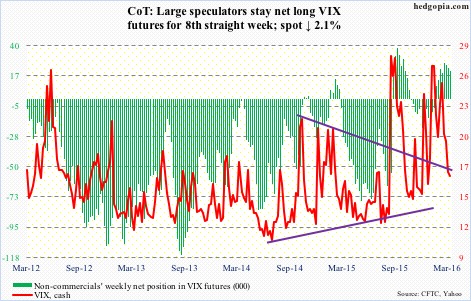
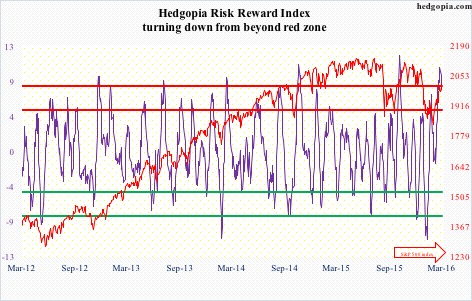
Hedgopia Risk Reward Index