The following are futures positions of non-commercials as of August 11, 2015. Change is week-over-week.
10-year note: How might the renminbi devaluation impact the Fed’s desire to hike rates this year? The devaluation is at least disinflationary as far U.S. imports from China are concerned. Yes, FOMC hawks such as Dennis Lockhart, the Atlanta Fed president, are itching to move. This week, he said data are inherently noisy month to month and quarter to quarter. Does he now have any choice but to vote ‘yes’ come September?
In the end, it may all boil down to if the Fed is determined to add some arrows to its monetary quiver or will let outside events influence its decision-making process. The China move does not seem to be a run-of-the-mill devaluation. The authorities let the currency slide for three straight sessions before letting it rise on Friday. It is not a coincidence that the People’s Bank of China moved after exports fell 8.3 percent year-over-year in July. The thing is, how will other exporters – particularly China’s Asian counterparts – respond to this? One day after the yuan devaluation, Vietnam widened the dong’s trading band to two percent from one percent previously.
Secondly, if we look across the globe, rates everywhere are either staying pat or going lower. The global economy is just not strong enough. If the Fed moves, how would that potentially impact the dollar, and by default U.S. exports? Nominal exports peaked at $2.36 trillion in 3Q14 and by 2Q15 were 3.4 percent lower. The Fed has a tough job at hand. The window of opportunity to move was probably much larger early this year, and has narrowed significantly. A missed opportunity!
Probably why non-commercials have stayed net long for four weeks now.
Currently net long 47.8k, up 15.3k.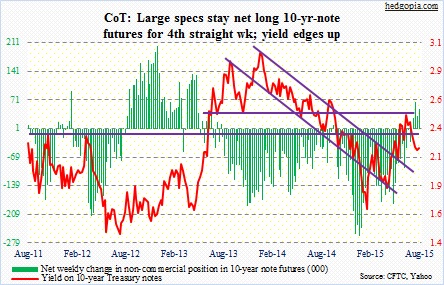
30-year bond: Here are the major economic releases next week.
On Monday, the Treasury International Capital data comes out for June. Of interest will be a shift – or a lack thereof – in holdings of Treasury securities among major oil exporters. Also, total foreign holdings of Treasury securities peaked in January at $6.22 trillion, and have dropped $83 billion since. Something to watch.
Housing starts for July will be released on Tuesday. This tends to be a volatile monthly series, but on a 12-month rolling average basis has been putting up good numbers – north of a million units in seven consecutive months.
The Consumer Price Index for July comes out on Wednesday. In June, it rose 0.3 percent, following a 0.4-percent rise in May. In the 12 months through June, the CPI just managed to inch up 0.1 percent; May was unchanged. Core CPI rose 0.2 percent in June, and 1.8 percent in the 12 months through June. Core CPI readings are higher than that shown by the PCE deflator; the latter supposedly is the Fed’s favorite inflation gauge.
Also on Wednesday, we get FOMC minutes for the July 28-29 meeting.
July’s existing home sales are published on Thursday. The June sales of 5.49 million units were the highest since February 2007, even as the median price jumped to an all-time high of $236,400. The question is, how might the price surge impact sales? Pending home sales in June were down 1.8 percent from May’s nine-year high, and they tend to lead sales of existing homes.
One Fed official is scheduled to speak next week.
Currently net long 11.6k, down 2.6k.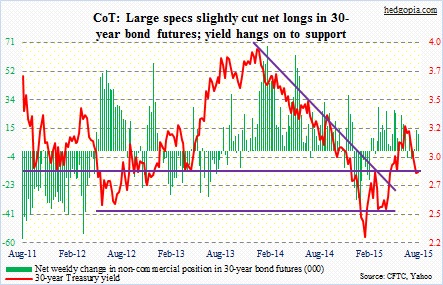
Crude oil: In the August 7th week, U.S. crude inventory fell by 1.7 million barrels per day to 453.6 mb/d. This was the third straight weekly drop. Stocks peaked at 490.9 mb/d in the April 24th week. The drop was no help to spot West Texas Intermediate, which went on to undercut the March low, losing 2.3 percent for the week.
Oil markets seem to be spooked by what is transpiring in China – the yuan devaluation combined with the authorities’ desperate attempts to prop up the stock market. These are probably sending wrong vibes about growth prospects.
Come fall, U.S. refiners will be entering planned maintenance season. And this. Come October, bank lenders will be performing a biannual review of the loans and revolving credit they have extended to E&P companies. The renewed drop in the price of crude does not help. Banks lend using reserves in the ground as collateral. The longer crude stays low, the more nervous they become.
Currently net long 266.4k, down 11.8k.
E-mini S&P 500: Valuation support is beginning to erode for stocks. Within a couple of weeks, 2015 operating earnings estimates for S&P 500 companies have been slashed by nearly $3 – from $114.73 on July 30 to $112.25 on August 6 to $112.03 on August 10 to $111.88 on August 13. Phew! That is some serious deceleration. By the way, 2014 was $113.02, so we are now looking at a down year. Estimates for 2016 continue to be laced with optimism – at $131.34. Should we even care? At the end of the second quarter last year, 2015 estimates were $137.50. It is a medium- to long-term worry. In fact, monthly momentum indicators have indeed turned lower on the S&P 500 Index.
With that said, there can always be trading opportunities. At least near-term, the path of least resistance is probably up. The Wednesday reversal was impressive. Short interest remains high, and shorts probably got squeezed that day. Some options-related metrics are at extremes. It is bulls’ loss if they cannot force a rally here.
Non-commercials are not buying this scenario. They increased net shorts 39 percent to a five-week high. It is not too hard to be bearish right now, come to think of it. Internals are rapidly deteriorating. The S&P 500 itself is caught between 50- and 200-day moving averages, with a mere 18 points separating the two, and the 50-day dropping. A death cross seems imminent, with the Dow Industrials just having experienced one.
Currently net short 162.4k, up 45.8k.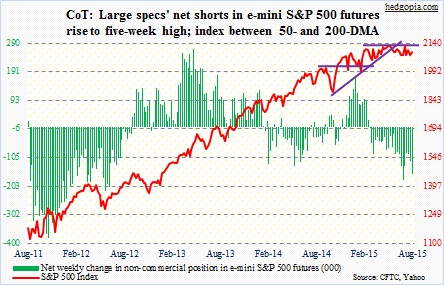
Euro: Eurozone GDP growth slowed to 0.3 percent in the second quarter from 0.4 percent in the first. There were three main tailwinds during the quarter: a weaker euro, low oil prices, and ECB stimulus. Obviously, growth could have been better. In the meantime, Eurozone CPI grew just 0.2 percent annually in July.
German, an exports powerhouse, benefits from a weak euro but is still having a tough go of it given the state of the global economy. Enter the yuan devaluation. Suddenly, the beamers will be more expensive in China. Odds are rising Germany will acquiesce to the ECB driving its QE to a higher gear.
Currently net short 115.2k, up 1.8k.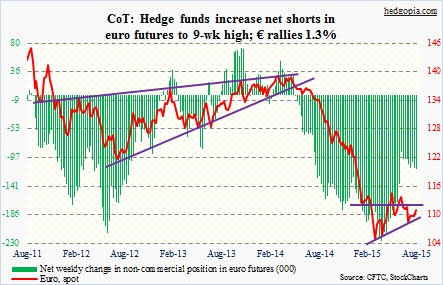
Gold: At one point, spot gold was up north of three percent during the week, but backed off. Resistance was heavy in the $1,140 range – support-turned-resistance as well as its 50-day moving average. Sellers showed up well before the metal could even test that resistance.
On a weekly basis, tons of oversold conditions still remain to get unwound, but the daily chart is overbought. The metal rallied five percent in 15 sessions. If it comes under pressure next week, in an ideal world there will be bids waiting at the $1,100 level. We will see.
Here is a possible scenario. Post-China devaluation, risk-off sentiment can rise in that nation, which, if comes to pass, should benefit the yellow metal. Obviously, the devaluation puts downward pressure on the purchasing power of the Chinese and upward pressure on inflation.
Non-commercials added to net longs for the second straight week.
Currently net long 32.4k, up 2.5k.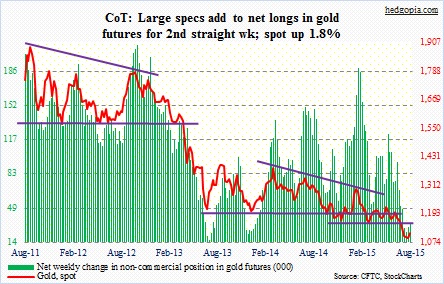
Nasdaq 100 index (mini): In the past couple of weeks, non-commercials have cut back net longs by 31 percent. It is possible these holdings are geared more toward the medium-term. Weekly momentum indicators still have a ways to go before overbought conditions are unwound. Not so near-term.
In the right circumstances, the Nasdaq 100 can rally. SOX, the semiconductor index, is trying to stabilize, even though it just had a 50/200 crossover. AAPL is trying to stabilize as well. And, on a daily chart, VXN, the Nasdaq 100 Volatility Index, seems to be itching to go lower.
Currently net long 61.8k, down 17.2k.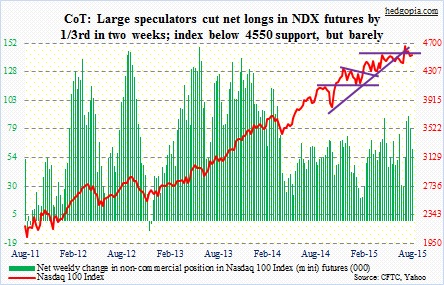
Russell 2000 mini-index: On Wednesday, RVX, the Russell 2000 Volatility Index, made it to the 20s before sharply reversing lower. It is probably not done going down near-term. The slightly rising 50-day moving average is a point lower, so small-cap bears will probably use that to try to exert downward pressure on the Russell 2000.
So far, bulls have done their best to deliver what was expected of them. During the week, the Russell 2000 was pushed below support going back to March last year, but they fought back to put the index smack on that make-or-break level. IWM, the iShares Russell 2000 ETF, in fact, is well over one percent above corresponding support.
Near-term, bulls deserve the benefit of the doubt.
Once again, non-commercials beg to disagree. Net shorts are at nearly five-month high.
Currently net short 38.1k, up 10k.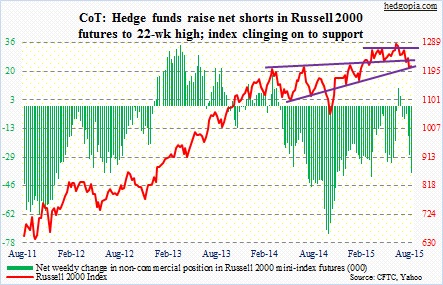
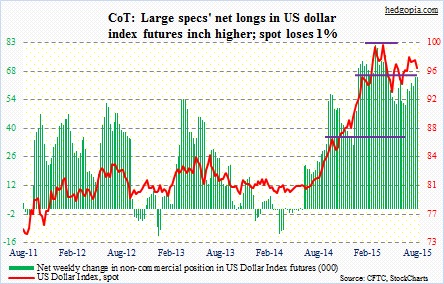
US Dollar Index: Six different currencies make up the US dollar index – the Japanese yen, the British pound, the Canadian dollar, the Swedish krona, the Swiss franc, and the euro – of which the latter has been given a whopping 57.6 percent weighting. The Chinese yuan is not included! This also meant the yuan devaluation this week did not impact the dollar index, which fell north of one percent. Incidentally, the trade-weighted dollar index, which includes 26 different currencies, gives the largest weight to the Chinese currency – obviously, as the index is trade-weighted. There are no futures on the trade-weighted index.
Currently net long 65.6k, up 420.
VIX: Once again, spot VIX was sold hard as soon as it rallied past 15 and into 16. So many times in the past, a VIX spike/reversal has been a good time to go long stocks – no matter how transient. This has the potential to be yet another one of those spikes.
In the midst of the Wednesday sell-off, a bunch of September 15 straddles were getting sold – a neutral strategy. At the same time, they were buying upside calls. These could be hedged trades, or straight directional bets.
The thing is, spot VIX is not that far away from its floor. So there is not a whole lot of room for it go lower.
Currently net short 62.5k, down 2k.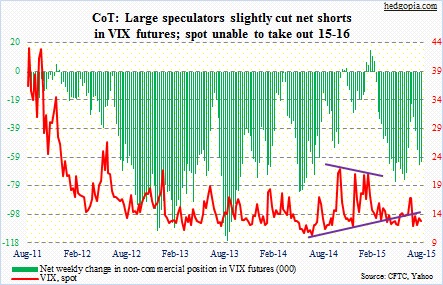
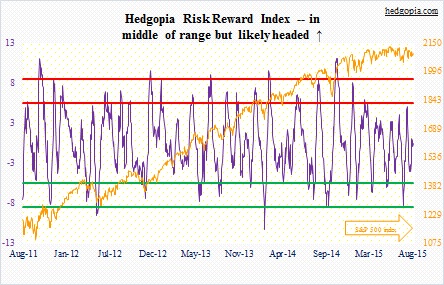
Hedgopia Risk Reward Index