The following are futures positions of non-commercials as of May 17, 2016. Change is week-over-week.
10-year note: More jawboning this week!
Last week, three regional bank presidents – Eric Rosengren (Boston), Loretta Mester (Cleveland), and Esther George (Kansas City) – delivered hawkish speeches, all hinting a rate hike was possible in June. All three were voting members.
This week, there was a similar message from three more – only this time they were all non-voting members.
Jeffrey Lacker (Richmond), John Williams (San Francisco), and Dennis Lockhart (Atlanta) all said two to three rate increases this year were possible.
Also, Robert Kaplan (Texas), a voting member, said the Fed should raise rates “in the not too distant future.” Then on Thursday, William Dudley (New York) said the central bank was on track for a June or July increase.
There is a clear disconnect between (first) Fed talk and action, and (second) potential Fed action and markets. The latter currently expect one hike at the most this year.
At the start of the week, fed funds futures were pricing in four-percent odds of a hike in June. Pre-FOMC minutes on Wednesday, this had risen to 12 percent. Post-minutes, this jumped to 32 percent.
Similarly, the two-year yield shot up to 0.9 percent on Wednesday, up from 0.72 percent last week, and the 10-year to 1.87 percent, up from 1.71 percent last week, TLT, the iShares 20+ year Treasury bond ETF, dropped 1.4 percent in that session.
For the first time time in nearly a decade last December, the Fed raised the fed funds rate to a range of 0.25-0.5 percent. Rates are still historically low. After seven years of recovery – subdued yes, but recovery nonetheless – the Fed cannot convince the markets that interest rates deserved to be a tad higher!
Currently net short 112.3k, up 33.1k.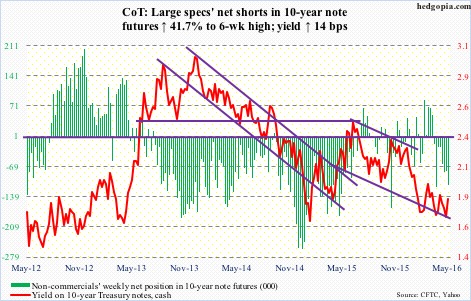
30-year bond: Major economic releases next week are as follows.
April’s new home sales are published on Tuesday. March was down 1.5 percent month-over-month to a seasonally adjusted annual rate of 511,000 units. The cycle peaked at 545,000 in February last year, which was a seven-year high. The median price was $288,000 in March, down from the all-time high $317,000 last November.
Thursday brings durable goods orders (April, advance) and pending home sales (April).
March orders for non-defense capital goods ex-aircraft – proxy for business capex – were essentially unchanged m/m at a seasonally adjusted annual rate of $66.9 billion. Year-over-year, orders have been down for 14 consecutive months. At $74 billion, the cycle high was reached in September 2014.
Pending home sales, which move hand in hand with existing home sales, rose 1.5 points in March to 110.5, not too far away from the cycle high 111.2 in April last year. The latter was the highest since 112.5 in May 2006.
On Friday, GDP (1Q16 second print), corporate profits (1Q16 preliminary) and the University of Michigan’s consumer sentiment (May final) come out.
The advance estimate showed 1Q16 real GDP grew at an anemic 0.5 percent, following rise of 1.4 percent in 4Q15 and two percent before that. This is much weaker than the post-Great Recession average of 2.1 percent and the 3.2 percent average going all the back to 2Q47.
Corporate profits adjusted for inventory and depreciation were $1.89 trillion in 4Q15. Profits peaked at $2.16 trillion in 3Q14, and have dropped for two straight quarters y/y.
Preliminarily, May consumer sentiment shot up 6.8 points to 95.8. This was the highest since 95.9 in April last year. The cycle peaked at 98.1 in January last year, which was an 11-year high.
Five FOMC members are scheduled to speak during weekdays, including Janet Yellen, Fed chair, on Friday at 10:30AM.
Currently net long 57.1k, up 6.4k.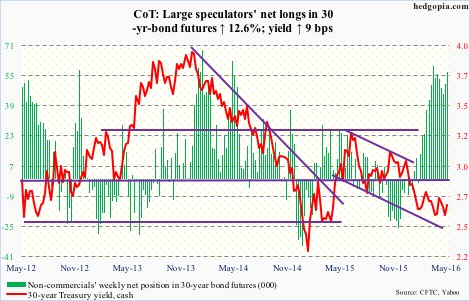
Crude oil: The weekly EIA report was mixed to slightly better.
For the week ended May 13th, crude stocks rose 1.3 million barrels to 541.3 million barrels, less than four million barrels from the all-time high 545.2 million barrels in October 1929. Plus, crude imports increased 22,000 barrels per day to 7.7 million b/d – a four-week high.
On the positive side, refinery utilization rose 1.4 percentage points to 90.5 percent – a six-week high.
Crude production continued to slide, this time by 11,000 b/d to 8.8 mb/d. This was the sixth straight sub-nine mb/d. Production peaked at 9.61 mb/d in the June 5th week last year.
And stocks of both gasoline and distillates fell – the former by 2.5 million barrels to 238.1 million barrels and the latter by 3.2 million barrels to 152.2 million barrels.
Spot West Texas Intermediate crude continued to rally – up another 2.9 percent for the week, and its sixth positive week in the past seven. Momentum, no matter how overbought, is intact, with shorter-term moving averages pointing up. Ditto with the 50-day, with the 200-day flat to slightly rising. That said, some signs of potential weakness are showing up on a daily chart.
Currently net long 371.2k, up 76.2k.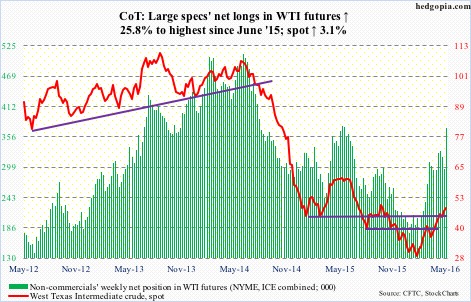
E-mini S&P 500: On Thursday, the S&P 500 at one point lost 2040 support before clawing its way back to close the session right on it. Intra-day, it dropped all the way to 2025.91, which was less than 15 points from the 200-day moving average. Does this qualify for a test of that average?
If the answer is yes, then the head-and-shoulders formation that has developed on the index probably does not complete – for now. Indeed, it rallied 0.6 percent on Friday.
That said, medium-term risks remain, as overbought conditions are still being unwound.
This is particularly so as outflows have accelerated. Another $3.9 billion came out of U.S.-based equity funds in the week ended Wednesday (courtesy of Lipper). North of $21 billion has left these funds in the past three weeks, and nearly $38 billion since the week ended February 10th.
SPY, the SPDR S&P 500 ETF, was a little different, as it attracted $944.3 million in the week ended Wednesday. But even here, since February 11th through this Wednesday, $3.1 billion has been redeemed.
Currently net short 8.9k, up 28.5k.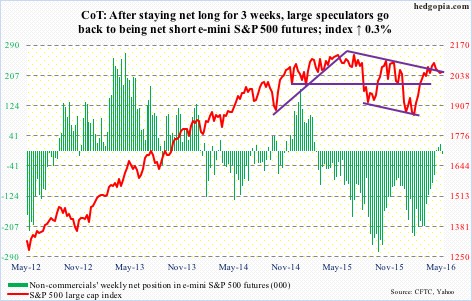
Euro: The Eurozone’s trade surplus widened in March to €22.3 billion from €20.6 billion m/m, due primarily to imports contracting more than exports. Exports fell 1.3 percent, while imports shrank 2.7 percent.
Everywhere we look, exports are weak. Competitive devaluation is rampant, but that is no panacea.
From the perspective of Eurozone exports, Mario Draghi, ECB president, must be a happy man in that the euro was not able to break out of 114-114.50. Turns out the breakout early this month was false. With a three-plus percent drop since, the currency is at the lower bound of a six-month ascending channel. A breakdown here only ensures more weakness.
Currently net short 22.6k, up 715.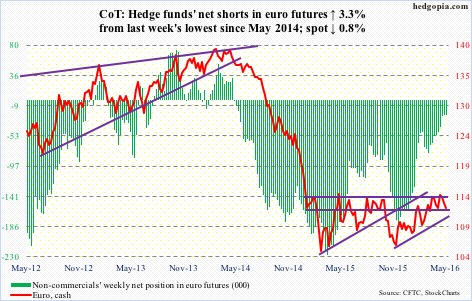
Gold: No breakout just yet. The metal continues to remain range-bound. Its run past 1,300/ounce in late April-early May proved fleeting.
As spot gold has gone sideways the past three-plus months, the 50-day moving average has now gone flat to slightly declining.
During all this, non-commercials took net longs in gold futures from 98,428 contracts on February 9th to 271,648 contracts on May 3rd. The longer gold fails to convincingly break out of the range it is in, the more the pressure these traders come under to reduce holdings. Thus far, they have shown patience.
Currently net long 266.3k, up 1.4k.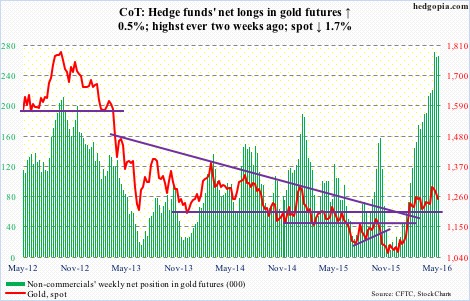
Nasdaq 100 index (mini): Having dropped below $90 on Thursday last week, Apple (AAPL) is back over $92. This support goes back to June 2014, or even September 2012. News that Warren Buffet had built a position in the stock attracted enough buying to push it past that price point.
AAPL makes up 10.5 percent of the index. But its positive influence was not large enough to save the Nasdaq 100 from losing 4350 support on Tuesday through Thursday, although barely. Come Friday, it was reclaimed.
The rather sideways action the past couple of weeks can exact a price though. In the week ended Wednesday, QQQ, the PowerShares Nasdaq 100 ETF, lost $215 million (courtesy of ETF.com). In the prior week, there were inflows – $447 million worth.
If Friday’s action is an indication, bulls have room to push the index toward its 50-day moving average, which is 1.4 percent away.
Currently net short 7.6k, down 1.7k.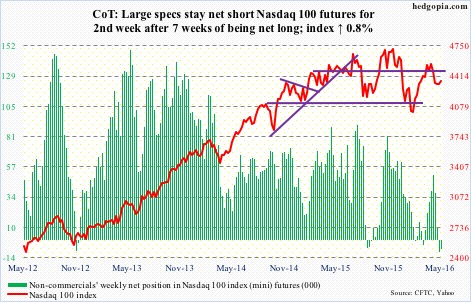
Russell 2000 mini-index: This week’s rally attempts were denied twice by the 200-day moving average and once by the 50-day. On Friday, it rallied 1.6 percent to close right on the latter.
Fortunately for small-cap bulls, the index never lost 1090-1120, a support range going back to October 2013. As well, RVX, the Russell 2000 volatility index, continued to struggle to take out 21.
If flows improve, there is room to rally near term. In the week ended Wednesday, IWM, the iShares Russell 2000 ETF, lost $1.9 billion, with $1 billion redeemed on Tuesday, when the index dropped 1.7 percent.
Longer-term, the broken March 2009 trend line is intact. April’s high kissed the underside of that trend line, but was rejected. This is a negative.
Currently net short 45.7k, up 65.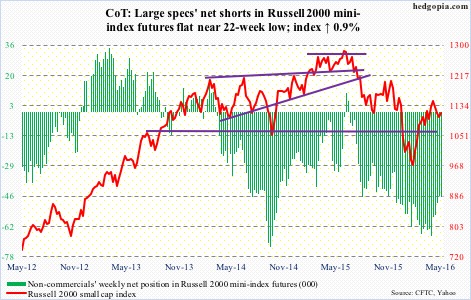
US Dollar Index: Closed just under the 50-day moving average for three straight sessions before breaking out on Wednesday. The April 26-27 FOMC minutes came to the rescue, as the message was interpreted as hawkish. The dollar index jumped 0.7 percent in that session.
The sudden tilt toward hawkish message among several regional Fed presidents has helped the dollar index, as the yield curve has shifted up, with the two-year having risen from 0.72 percent on May 10th to 0.9 percent on May 18th and the 10-year from 1.71 percent on May 13th to 1.87 percent on May 18th.
In this regard, Ms. Yellen’s Friday speech will be crucial – see if she continues her hitherto dovish message or changes the tune.
Based on how they are positioned, non-commercials still look tentative – not yet convinced if the recent rally in the dollar index is for real.
Net longs are near two-year lows.
Currently net long 10.4k, down 1.7k.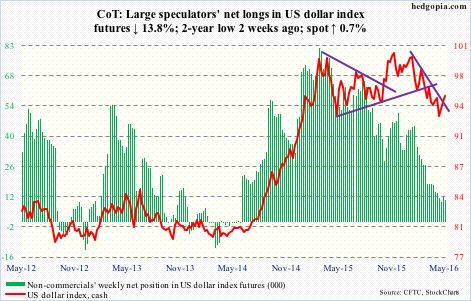
VIX: Arguably, there is good news for both volatility bulls and equity bulls. For the former, the 50-day moving average is flattish to slightly falling; on Wednesday, intra-day weakness was bought near that average, which likely gets tested again next week. For the latter, resistance at 16-17 has held for the past couple of months.
Historically, once 16-17 is taken out, spot VIX has shown a tendency to rally, even spike. On Thursday, it jumped to 17.65 intra-day, only to give back most of the gains by close. This was the highest print since the middle of March. However, the session went on to produce a gravestone doji – potentially bearish near term. This also came right outside the upper Bollinger Band. Come Friday, VIX was handed out a 6.9-percent thumping.
Currently net short 94.8k, up 6.8k.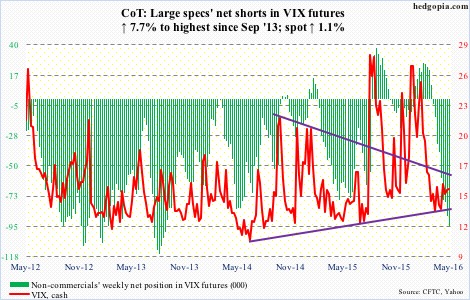
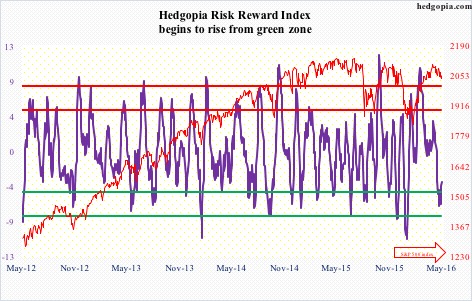
Hedgopia Risk Reward Index