Following futures positions of non-commercials are as of December 27, 2016.
10-year note: TLT, the iShares 20+ year Treasury bond ETF, has had a nasty drop since it reached a historic high of $141.91 on July 8 this year. Two days prior, 10-year T-yields bottomed at a historic low of 1.34 percent. From that low through 2.62 percent on December 15, yields expanded by 128 basis points. In five months! TLT dropped all the way to $116.50 on December 16.
Behind this rerating lies bond market’s optimism that President-elect Donald Trump would be able to deliver on his growth promises through tax overhaul, cuts in regulations, and infrastructure spending. A lot is priced in the long end of the curve. What might throw a monkey wrench in the works?
Leverage is heavy, with national debt just under $20 trillion, up from $11.5 trillion when Great Recession ended. Productivity barely exists. The economy is in its 8th year of recovery, and the government runs a budget deficit. Budget hawks in Congress are less likely to acquiesce to any and every stimulus program.
In a larger scheme of things, despite the recent surge, 10-year yields remain within a 30-year descending channel, the top end of which will be tested just north of three percent. If the bond market is right, that trend line likely gets broken next year. But that is assuming a lot.
Right here and now, odds are growing that yields head lower from here – if nothing else, just to digest the recent gains and see if the new administration gets traction in its election promises.
Non-commercials have built the most net shorts ever, a reversal of which is bound to put downward pressure on the 10-year (2.45 percent). Nearest decent support lies at 2.19 percent (gap-up), which also approximates the 50-day moving average (2.22 percent).
In this scenario, TLT ($119.13) rallies.
Currently net short 341.1k, up 120k.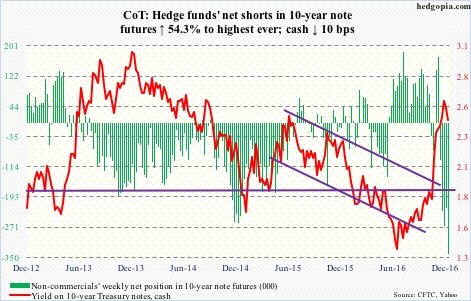
30-year bond: Major economic releases next week are as follows. Happy New Year 2017!
Tuesday brings December’s ISM manufacturing index. November was up 1.3 points month-over-month to 53.2, matching June’s (2016) reading. Orders were up nine-tenths of a point to 53 – and are subdued.
FOMC minutes for the December 13-14 meeting come out on Wednesday. The Fed raised the fed funds target range by 25 basis points to 0.5 percent-0.75 percent. This was the first hike since December 2015.
December’s ISM non-manufacturing index is published on Thursday. November activity rose 2.4 points m/m to a 13-month high 57.2. Orders slid seven-tenths of a point to 57 – a three-month low.
The employment report (December) and durable goods (November, revised) are reported on Friday.
The U.S. economy added 178,000 non-farm jobs in November, for a monthly average this year of 180,000. Jobs momentum has been slipping. In 2015, the average was 229,000, which itself was softer than 251,000 in 2014.
Orders for non-defense capital goods ex-aircraft – proxy for business capital expenditures – rose 0.9 percent m/m in November to a seasonally adjusted annual rate of $63.4 billion, but shrank 3.2 percent year-over-year. This is the 13th straight y/y contraction.
Currently net short 21.5k, up 10.2k.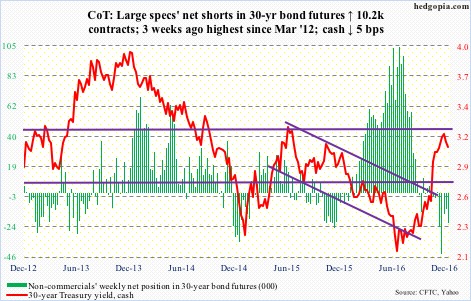
Crude oil: Spot West Texas Intermediate crude ($53.72) continues to hover above support at $52, but not much progress has been made in the past three weeks. The last three sessions this week were spinning tops on the daily chart. The path of least resistance remains down.
Since OPEC’s output cutback deal on November 30, U.S. crude production has gone up, but not by a whole lot, although the risk is probably to the upside. In the week ended December 2, production was 8.7 million barrels per day. In the week ended last Friday, this stood at 8.77 mb/d, down 20,000 b/d week-over-week.
Crude imports fell by 304,000 b/d to 8.2 mb/d.
Stocks of gasoline and distillates fell, too, by 1.6 million barrels to 227.1 million barrels and by 1.9 million barrels to 151.6 million barrels, respectively.
Crude stocks, however, rose to 486.1 million barrels, up 614,000 barrels, to a four-week high. Refinery utilization dropped a tad, down 0.5 percent to 90 percent; the prior week was at a 13-week high.
Currently net long 439.1k, up 4.7k.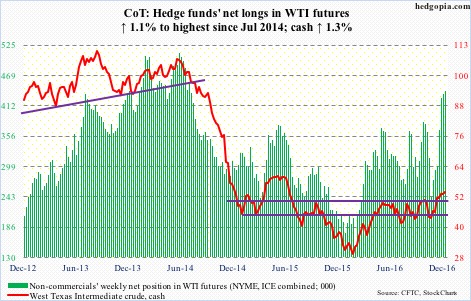
E-mini S&P 500: It finally got resolved. The small flag/pennant on the cash on the daily chart was broken to the downside on Wednesday. The index also lost the 10-day moving average – now declining – followed by the loss of the 20-day on Friday.
There is support at 2190-2200, which also approximates the 50-day moving average (2194.92).
Leading up to this, the Dow Transports peaked as early as December 9, even as the Dow Industrials did so on the 20th – so much for the false Dow Theory buy signal.
In the days ahead, it will be interesting to see how money that moved into SPY, the SPDR S&P 500 ETF, post-Trump win will react to the lack of a Santa rally this year. The ETF attracted $20 billion post-election. In the week ended this Wednesday, $606 million came in, which essentially offset the $584 million in outflows in the prior week (courtesy of ETF.com). Interestingly, on Wednesday when the S&P 500 dropped 0.8 percent, $1.1 billion came in. Stealth distribution?
For a lack of funds, a process of unwinding can begin given how overbought conditions are – particularly weekly.
This at a time when equity bulls increasingly seem unwilling to take on additional margin debt.
On a positive note, U.S.-based equity funds in the week to Wednesday attracted $11.8 billion, offsetting more than half of the $21.6 billion in outflows in the prior week (courtesy of Lipper).
Currently net long 9.7k, up 44.6k.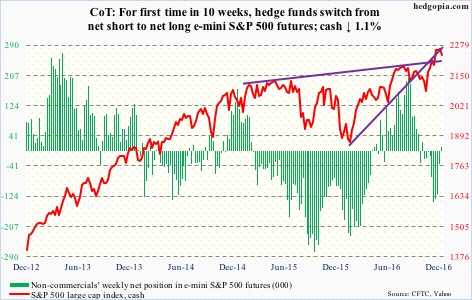
Euro: Bank lending to Eurozone non-financial companies in November grew by 2.2 percent – the fastest rate since 2009. Lending to households increased by 1.9 percent – the fastest pace since mid-2011.
Two weeks ago, the euro (cash) lost horizontal support going back to March last year, followed by sideways action for several sessions. On Thursday, the currency finally closed above the 10-day moving average, and has room to rally. The area of interest continues to be 105-plus, the broken support-turned-resistance, which is where it closed on Friday.
Currently net short 69.4k, down 8.6k.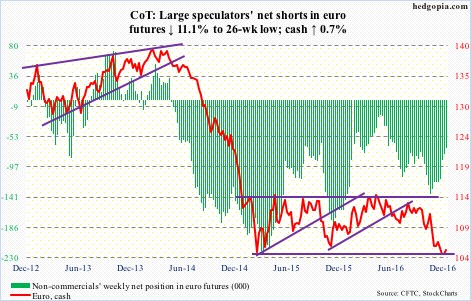
Gold: The cash finally closed above the 10-day moving average on Wednesday (first time since November 4), and followed up with a close above the 20-day in the very next session, but was not able to hang on to it. Come Friday, resistance at $1,165-70 repelled a rally attempt.
Gold bugs nevertheless should be happy that the cash saw a first up week after seven straight down weeks.
Once bids begin to show up, this potentially at least puts a stop to the persistent outflows GLD, the SPDR gold ETF, has experienced of late. In the week ended Wednesday, the ETF only lost $43 million. This was the seventh straight week of redemptions, during which $5.1 billion was withdrawn (courtesy of ETF.com).
Currently net long 98.3k, down 16.5k.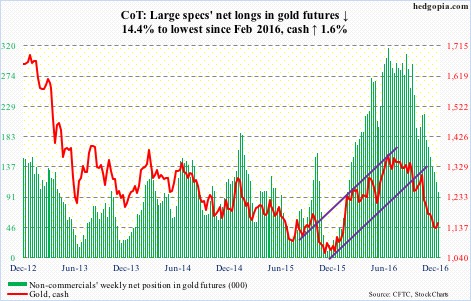
Nasdaq 100 index (mini): In what looked like a shooting star session on Tuesday, the cash rose to a new all-time high of 4992.08, but only managed to close at 4965.81. In the next session, it fell 0.8 percent, followed by a 1.1-percent drop on Friday. Wednesday was also a session in which QQQ, the PowerShares Nasdaq 100 ETF, saw inflows of $338 million (courtesy of ETF.com). Someone is selling, taking advantage of these inflows.
Was that a bull trap? Too soon to say, but it is possible.
On Friday, the cash went on to lose 4900 as well as its 20-day moving average. The 50-day is 23 points away.
Currently net long 83.5k, up 8.6k.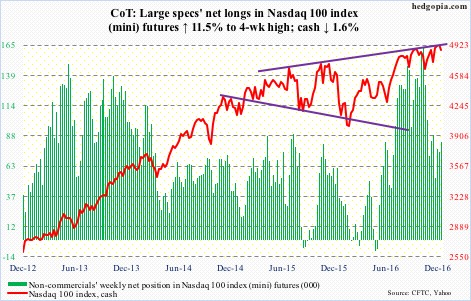
Russell 2000 mini-index: The declining trend line from the December 9th record high of 1392.71 stopped another rally attempt on Tuesday. From the perspective of small-cap bulls, support at 1350-ish is holding. Bears have been hammering on this since the middle of the month, and one has to wonder how long before it is cracked.
Thus far, flows are cooperating. In the week ended Wednesday, another $382 million moved into IWM, the iShares Russell 2000 ETF. This followed inflows of $516 million in the prior two (courtesy of ETF.com). The problem is, the Russell 2000 has gone nowhere in over three weeks.
Non-commercials are the biggest wildcard in this. They have amassed net longs up to the gills, and tend to be trend-followers. Since that December 9th peak, the cash is down 2.6 percent.
Currently net long 91.3k, down 1.1k.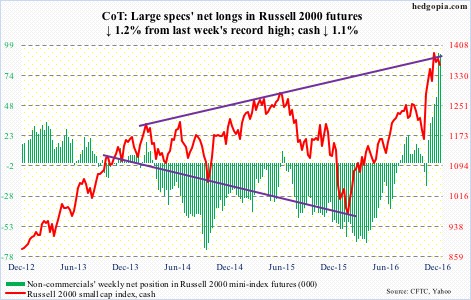
US Dollar Index: Since the cash broke out of 102 in the middle of the month, it has essentially gone sideways within a box. That support – the 20-day moving average lies right there – still holds, but barely. On Friday, in a long-legged doji session, it was tested – successfully. Earlier on Thursday, the 10-day was lost. A loss of both averages – probably only a matter of time – should begin a process of unwinding the overbought conditions the cash is in.
The cash had been rising since May this year. Post-election, the rally accelerated – up nearly six percent through December 20. Dollar bulls already expended a lot of buying power.
Currently net long 52.6k, up 277.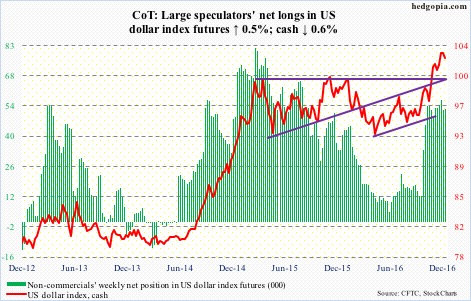
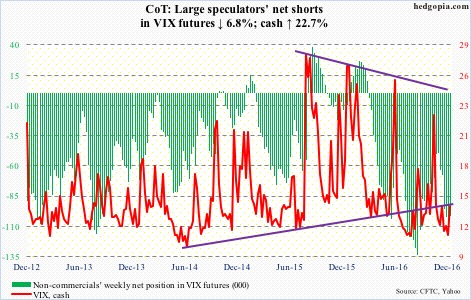
VIX: From the December 21st sub-11 reading of 10.93, the cash (14.04) rallied in all six sessions, past both 10- and 20-day moving averages, which are now flat to curling up. A big test lies ahead. Both 50- and 200-day are right here (13.97 and 14.33, respectively). If they get taken out, stocks likely will have a rough January.
After three successive sub-.80 readings – and in four out of five – the VIX-to-VXV ratio rose to .85 this week, and has a long way to go before it enters overbought territory.
Currently net short 101.5k, down 7.4k.