Following futures positions of non-commercials are as of February 21, 2017.
10-year note: Are we in for a March shock?
Post-FOMC minutes on Wednesday, fed funds futures were pricing in a 32-percent chance of a rate hike in the March 14-15 meeting, down from 34 percent pre-minutes.
When the Fed hiked last December – second in 10-plus years – the dot plot suggested three hikes this year. But markets are not buying the Fed’s bluff. They expect two.
Indeed, if there is no hike in March, the Fed will have to hike every other meeting for the rest of the year. Always possible, but given that it has habitually looked for excuses not to hike, at least in markets’ eyes, it is not probable.
So if the Fed wants the markets to take it seriously, it should go for it in March. A new version of shock and awe.
As much as one would like to buy into this scenario, it in all likelihood does not come to pass.
In four months, the U.S. economy will have completed eight years of recovery. Yes, subdued, but recovery anyway. Yes, capacity utilization never crossed 80 percent in the current cycle, but does 75-plus utilization deserve 0.66-percent fed funds rate? Probably not. Hence markets’ unwillingness to take the Fed at face value.
Currently net short 302.3k, down 39.2k.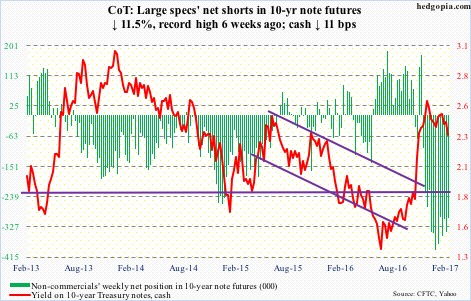
30-year bond: Major economic releases next week are as follows.
Durable goods orders and pending home sales – both for January – are published on Monday.
Orders for non-defense capital goods ex-aircraft – proxy for business capital expenditures – increased 2.9 percent year-over-year in December to a seasonally adjusted annual rate of $64.6 billion. This was the first increase in 14 months. Orders peaked at $70.7 billion in September 2014.
Pending home sales rose 1.7 points month-over-month in December to 109. Cycle high 115 was reached in April last year, which was the highest since 115.4 in March 2006.
Tuesday brings GDP (4Q16, 2nd estimate) and the S&P Corelogic Case-Shiller housing price index (December).
The advance estimate showed growth in real GDP decelerated to 1.9 percent from 3.5 percent in 3Q16. This is lower than the average 2.1 percent in the current recovery (3Q09-4Q16), let alone the 3.2 percent the economy has grown on average going back to 2Q47.
Nationally, home prices advanced 5.7 percent y/y in November. This was the fifth straight month prices accelerated each month.
Personal income (January) and the ISM manufacturing index (February) come out on Wednesday.
Core PCE (personal consumption expenditures) – the Fed’s favorite measure of consumer inflation – increased 1.7 percent y/y in December. Prices have been trending higher since 1.31 percent in July 2015, but the last time they rose north of two percent was in April 2012.
Manufacturing activity expanded 1.5 points m/m in January to 56, which was the highest since 57.6 in November 2014. Orders inched up one-tenth of a point to 60.4, which too was the highest since 63.5 in November 2014.
The ISM non-manufacturing index for February is published on Friday. January inched down one-tenth of a point m/m to 56.5. Services orders dropped 2.1 points to 58.6.
Currently net short 23.7k, down 2.5k.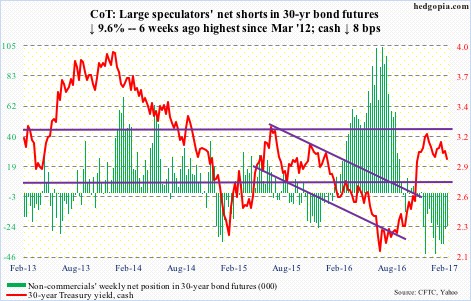
Crude oil: Yet another record in U.S. crude stocks. Last week, inventory rose by 564,000 barrels to 518.7 million barrels.
The latest EIA data (week ended February 17) also showed that gasoline and distillate stocks fell – by 2.6 million barrels and 4.9 million barrels, respectively, to 256.4 million barrels and 165.1 million barrels. And this is what oil bulls latched on to Thursday, when West Texas Intermediate crude rallied 1.6 percent. That said, these stocks remain elevated. In the week ended February 10, gasoline stocks were the highest ever at 259.1 million barrels, and distillate stocks at 170.7 million barrels were the highest ever in the week ended February 3.
Last week, crude imports, too, fell – by 1.2 million barrels per day to seven-week low 7.3 mb/d.
Crude production, on the other hand, inched up 24,000 b/d to 46-week high nine mb/d. And refinery utilization dropped 1.1 percentage points to 84.3 percent. This was the lowest since April 26, 2013.
While the bulls deserve kudos to be able to ignore the negative and embrace the positive, they at the same time have not been able to convincingly break out at a time when OPEC is telling us they have 90 percent compliance.
So the grind continues on the cash – sideways for 11 weeks – even as non-commercials hold record net longs.
The weekly MACD on the cash is itching to cross under – potentially bearish.
Currently net long 569.7k, up 39.3k.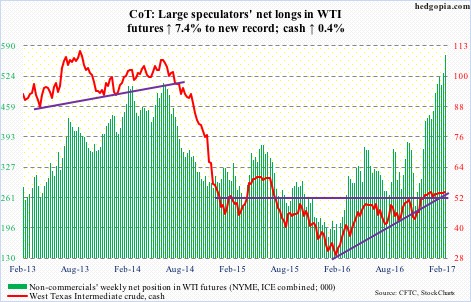
E-mini S&P 500: Flows continue to cooperate.
In the week ended Wednesday, U.S.-based equity funds took in another $2.7 billion. This was the fourth consecutive week of inflows during which $30.4 billion moved in. Since the November 8 election last year, these funds attracted $44.8 billion (courtesy of Lipper).
Flows into SPY, the SPDR S&P 500 ETF, have not been as uniform, with the last five weeks alternating between inflows and outflows. This week (through Wednesday), the ETF lost $1.5 billion. Although since the election, inflows have been to the tune of $16.8 billion (courtesy of ETF.com).
At a time when earnings continue to be lackluster, inflows, along with short squeeze, have been a big help, with the S&P 500 (cash) up nearly 11 percent post-election! As extended as the index is, reversal signs are yet to flash.
Currently net long 30.8k, down 27k.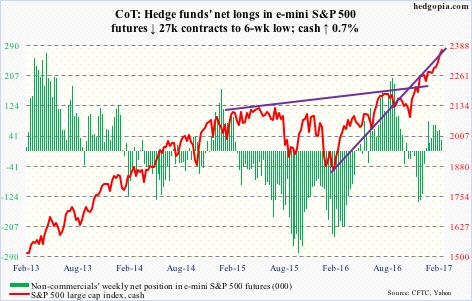
Euro: Support at 105-plus was breached intraday Wednesday before the cash was bid up to end the session up 0.2 percent. Technically, there is room to rally on the daily chart, but euro bulls have their work cut out. Both 10- and 20-day moving averages are pointing lower, while the 50-day is flattish.
For whatever it is worth, bulls have an opportunity to carve out the right side of an inverse head-and-shoulders pattern, the neckline of which will be broken around 108.
Currently net short 58.3k, up 11.5k.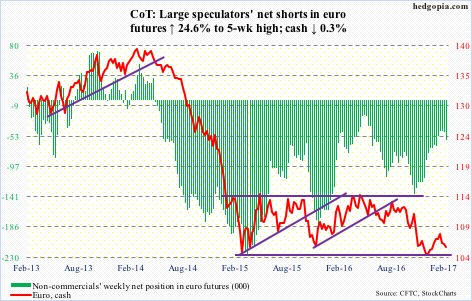
Gold: Resistance at $1,246 was taken out Thursday, after the cash went sideways for two weeks around its 10-day moving average. This was a price level off of which the cash rallied in October last year. The 200-day moving average ($1,264.59) is merely 0.5 percent away, and should be tested next week. After that, gold bugs would love to test a declining trend line from July last year, which will occur around $1,280.
For that, flows need to cooperate. In the week ended Wednesday, GLD, the SPDR gold ETF, lost $95 million. This followed $1.8 billion in inflows in the prior three (courtesy of ETF.com).
Currently net long 123.8k, up 14k.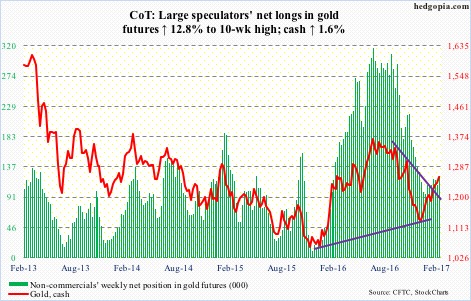
Nasdaq 100 index (mini): Thursday’s candle engulfed Wednesday’s on the cash. In normal circumstances, having come after a relentless rally, this would at least raise a yellow flag. Would this end up being the case this time around? Is momentum waning? Possibly, but not sure.
As things stand, for bears to get any traction, shorter-term averages (daily) need to begin a process of rolling over – they are still rising, as is the 50-day. The 10-day was defended Friday.
In the meantime, in the week ended Wednesday, QQQ, the PowerShares Nasdaq 100 ETF, attracted $438 million. This comes in the wake of outflows of $1.3 billion (courtesy of ETF.com).
Currently net long 79.4k, down 10.3k.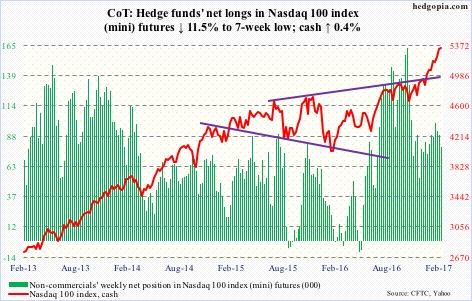
Russell 2000 mini-index: On February 13, the cash broke out of two-month resistance at 1390-ish, subsequently rallying to 1410.40 on the 21st. The index is struggling to build on that breakout, as pressure builds on daily indicators to unwind overbought conditions. The 50-day moving average is now flat. And the weekly chart in on the verge of a bearish MACD cross-under.
Bulls have their work cut out.
In the week ended Wednesday, IWM, the iShares Russell 2000 ETF, lost $521 million (courtesy of ETF.com).
Currently net long 36.5k, down 12.2k.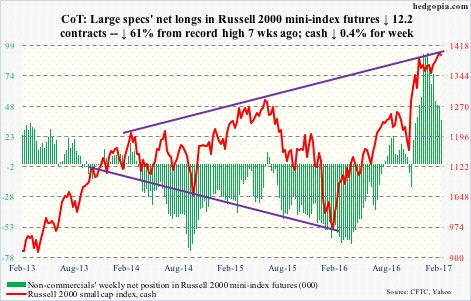
US Dollar Index: FOMC minutes for January 31-February 1 meeting were not hawkish enough for markets to aggressively price in a March hike. At least that is the message coming out of the currency market.
On Wednesday, the day those minutes were released, the cash lost 0.2 percent, as it was once again rejected at the 50-day moving average – and again on Thursday. Dollar bulls need to step up and defend still-rising 10- and 20-day. The latter was defended Friday. But the daily chart is itching to go lower.
Currently net long 45.8k, down 47.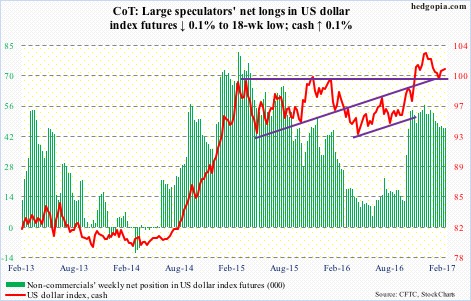
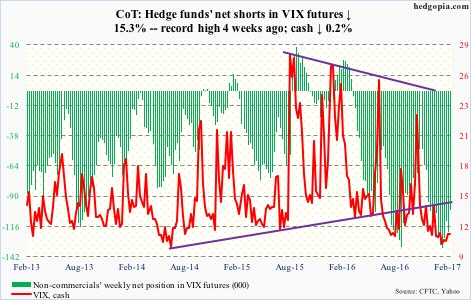
VIX: Through Friday, for six straight sessions, the cash intraday tried to conquer the 50-day moving average and failed. For volatility bulls’ consolation, the average is now flat, as are both 10- and 20-day. As well, on the monthly chart, February thus far is a doji.
In the meantime, the VIX-to-VXV ratio, after a rise to .84 last week, once again dipped back into the .70s. The ratio has now lingered there for seven of last eight weeks – and in 11 out of last 14.
Volatility compression continues. Even the best rubber band will only stretch so far.
Currently net short 102.2k, down 18.4k.