Following futures positions of non-commercials are as of February 28, 2017.
10-year note: By Friday last week, fed funds futures were putting the odds of a rate hike in the upcoming FOMC meeting (March 14-15) at 34 percent. By Monday, this rose to 50 percent, then to 84 percent by Tuesday and to 90 percent by Thursday. What brought about this rapid sentiment shift?
On Tuesday in particular, William Dudley, New York Fed president, told CNN that the case for tightening has become a “lot more compelling”, adding “animal spirits have been unleashed a bit” post-Nov 8 presidential election.
Also Tuesday, John Williams, San Francisco Fed president, sounded hawkish. Ditto with Robert Kaplan, Dallas Fed president, last week and Lael Brainard, governor, Wednesday. Later on Friday, Janet Yellen, chair, said a March hike was likely.
Dudley is one of the triumvirates at the Fed – the other two being Yellen and Stanley Fischer, vice-chair – and has been a dove. Interesting for him to bring up the ‘animal spirits’ phrase.
As well, this is a Fed that has been enamoured with the so-called wealth effect, acting – both verbally and in policy – anytime stocks came under decent pressure. That probably remains the case. But the use of ‘animal spirits’ also says they are probably not happy with the current trajectory in equities. In four months post-election, the S&P 500 large cap index rallied 12 percent!
Thus, unless stocks collapse in the next seven sessions, the track is laid for the Fed to make a move.
Any possible kink? Yes, the yield curve is flattening. The long end is not cooperating as much as the Fed would probably like.
Currently net short 409.7k, up 107.4k.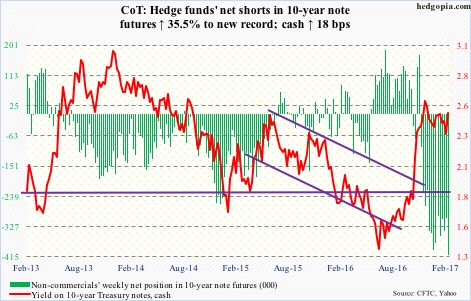
30-year bond: Major economic releases next week are as follows.
January’s revised estimates for durable goods, as well as non-durable, are published Monday. The advance report showed orders for non-durable capital goods ex-aircraft – proxy for business capital expenditures – were down 0.4 percent month-over-month to a seasonally adjusted annual rate of $64.6 billion. They rose 0.5 percent year-over-year – second straight up month after 13 down. Orders peaked at $70.7 billion in September 2014.
February’s NFIB small business optimism index is reported Tuesday. January inched up one-tenth of a point m/m to 105.9 – the highest since December 2004. Last November through January, the index jumped 11 points. This post-election optimism is yet to translate to other sub-indexes, however. Comp plans, for instance, fell a point to 18 in those three months.
Revised productivity data for 4Q16 come out Wednesday. Preliminarily, nonfarm business sector output per hour increased at an annual rate of 1.3 percent, downshifting from 3.5 percent growth in 3Q16. That said, this was preceded by negative readings in 4Q15-2Q16.
Friday brings February’s employment report. January saw the economy add 227,000 nonfarm jobs. In all of 2016, monthly average gain was 187,000, versus 226,000 in 2015 and 250,000 in 2014. Deceleration is evident. Thus, the January print in all probability is an exception than a rule.
Currently net short 21.9k, down 1.9k.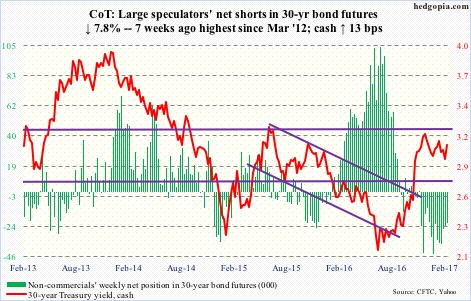
Crude oil: One more unsuccessful attempt at convincingly taking out resistance at $54-plus on spot West Texas Intermediate crude – now sideways for 12 weeks. Thursday, the crude sliced through the 50-day moving average – flat to slightly dropping – which was then recaptured Friday.
Will the bulls be able to continue to save support at $52-plus? Probably not. Weekly momentum indicators have turned lower. The rising trend line from the lows of February last year gets tested around $50.
In the meantime, U.S. crude inventory last week rose to yet another record – up 1.5 million barrels to 520.2 million barrels.
Crude imports rose, too – up 303,000 barrels per day to 7.6 million b/d. As did production, which increased 31,000 b/d to 9.03 mb/d.
Refinery utilization, however, increased 1.7 percentage points to three-week high 86 percent. The prior week was the lowest since April 26, 2013.
And there was improvement in stocks of both gasoline and distillates. The former dropped 546,000 barrels to 255.9 million barrels and the latter fell 925,000 barrels to 164.2 million barrels, although both remain elevated. In the week ended February 10, gasoline stocks were the highest ever at 259.1 million barrels, and in the week ended February 3 distillate stocks at 170.7 million barrels were the highest ever.
Currently net long 554k, down 15.7k.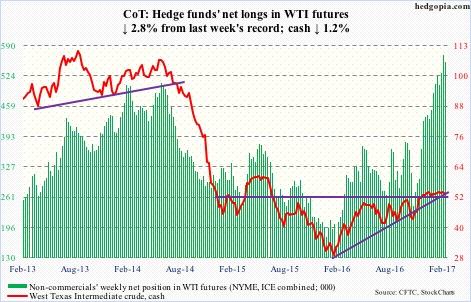
E-mini S&P 500: Stocks’ response to Tuesday’s State of the Union is eliciting phrases such as ‘blow off top’. Maybe, maybe not. Indeed, the S&P 500 (cash) rallied 12 percent since November 8 last year (election day). As insane as the move has been, every dip to 10- and 20-day moving averages has been gobbled up … so far. There likely will be another test next week.
Sentiment remains euphoric. The NAAIM exposure index was in the 90s in 13 of the last 14 weeks – five of them north of 100. Investors Intelligence bulls have been north of 55 in the last 15 weeks, with seven of them in the 60s.
These are abnormal readings, along with several others. On Wednesday, 84 percent of S&P 500 companies were above their 200-day moving average.
But as long as the crowd wants to play this casino – feels like it – this continues.
In the week ended Wednesday, $4.5 billion moved into SPY, the SPDR S&P 500 ETF (courtesy of ETF.com). In the same week, U.S.-based equity funds took in $7.3 billion, for a total of $37.7 billion in the past five (courtesy of Lipper). Since the election, these two attracted $21.3 billion and $52.1 billion respectively.
When the music stops, those with one foot out the door are likely to exit with ease.
Currently net long 86.6k, up 55.9k.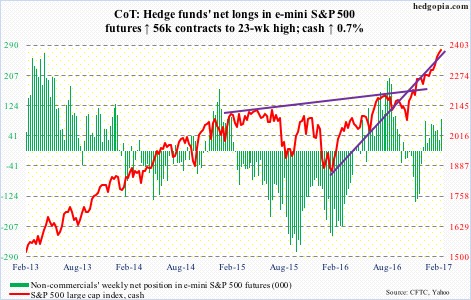
Euro: Eurozone consumer prices rose two percent from a year ago in February – the fastest pace since January 2013. Core inflation only increased 0.9 percent. The ECB focuses on the latter. The euro reacted to the news with a yawn, with the cash dropping 0.4 percent on Thursday to 105.06. Support at 105-plus has been saved – has room to rally on the daily chart.
Currently net short 51.2k, down 7.1k.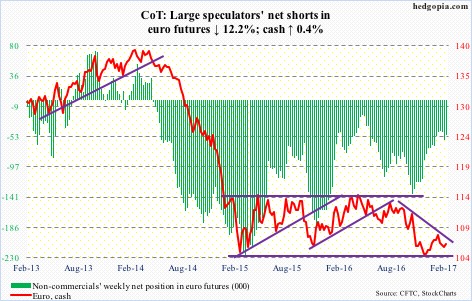
Gold: In Monday’s long-legged doji session, the cash did test the 200-day moving average but was rejected. This preceded a 12.5-percent rally from December 15 last year. Come Thursday, it lost shorter-term moving averages. The rising 50-day is 1.8 percent away, and likely gets tested.
At the moment, public seems disinterested. Wednesday, GLD, the SPDR gold ETF, attracted $96 million. This was the first time the ETF saw activity – in or out – in seven sessions (courtesy of ETF.com).
As well, non-commercials took net longs to a 14-week high, but was no help to the metal.
Currently net long 163.8k, up 40k.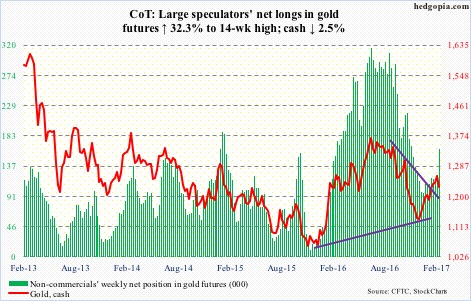
Nasdaq 100 index (mini): In the week ended Wednesday, QQQ, the PowerShares Nasdaq 100 ETF, attracted $1 billion (courtesy of ETF.com). The Nasdaq 100 (cash) jumped 1.1 percent Wednesday to a new intraday high 5398.43.
Post-election, bulls have consistently stepped up to defend 10- and 20-day moving averages. Friday, buyers showed up near the 10-day, which looks to be on the verge of at least going flat.
Currently net long 83.8k, up 4.4k.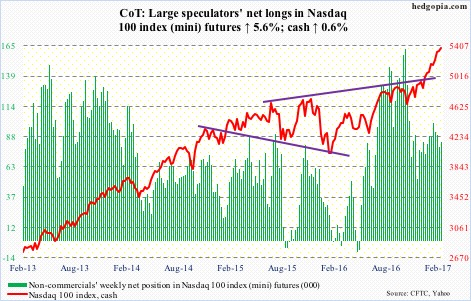
Russell 2000 mini-index: In a session that saw the cash rally two percent to a new intraday high 1414.82, IWM, the iShares Russell 2000 ETF, lost $145 million on Wednesday – part of the $481 million in outflows in that week (courtesy of ETF.com). This followed redemptions of $521 million in the prior week.
Hedge funds have been cutting back since they accumulated the most net longs early this year. Small-cap bulls hence cannot afford to lose the support of the small investor. The index is struggling to get traction, having moved sideways for 13 weeks. The weekly chart just completed a bearish MACD cross-under.
Currently net long 19.7k, down 16.8k.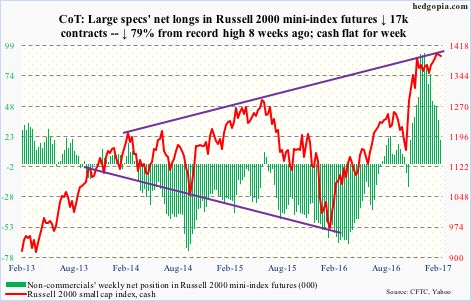
US Dollar Index: Two-year yields Thursday shot up to 1.32 percent – the highest since June 2009. The dollar index (cash) was in tow, rallying past important resistance at 102, which it lost Friday anyway. This could potentially form the right shoulder of a head-and-shoulders formation. The 50-day moving average – flat to slightly dropping – is merely 0.1 percent away. Friday’s 0.8-percent drop came in a session in which Yellen stated a March hike was likely.
Non-commercials continue to cut back net longs.
Currently net long 44.8k, down 1k.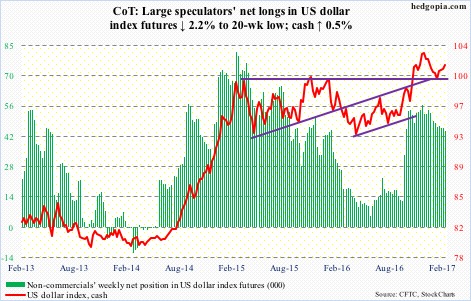
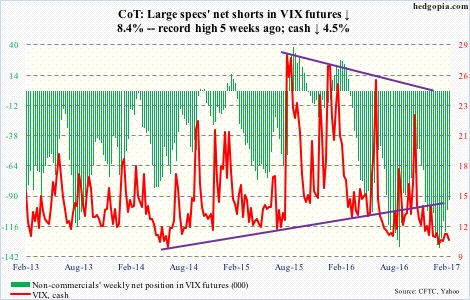
VIX: The cash stayed above the 50-day moving average in the first four sessions before giving it back on Friday – first sub-11 close in three weeks. The lower Bollinger band (daily) is 4.8 percent away.
In the meantime, the VIX-to-VXV ratio put in yet another close in the .70s. The ratio has now lingered there for eight of last nine weeks – and in 12 out of last 15.
The rubber keeps getting stretched.
Currently net short 93.6k, down 8.6k.