
Following futures positions of non-commercials are as of March 28, 2017.
10-year note: Currently net short 69.4k, down 30.9k.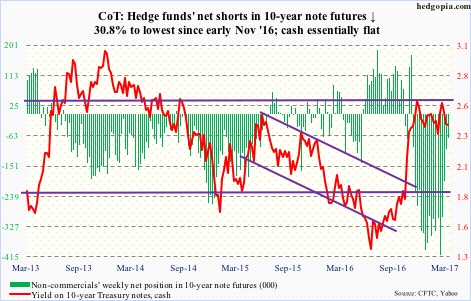
Fed officials are beginning to jawbone – again.
Tuesday, Stanley Fischer, Fed vice-chair, said he forecasts two more hikes this year. This is in line with the three hikes this year forecasted by the dot plot. A day later, Eric Rosengren, Boston Fed president, and John Williams, San Francisco Fed president, went further, saying not to rule out three more this year.
This is music to the ears of non-commercials who are holding record eurodollar net shorts.
Importantly, the Fed’s new-found zeal to tighten is not in response to a sudden acceleration in growth. If anything, the post-Great Recession recovery is three months from completing eight years and is beginning to show a wear and tear here and there.
Take banks’ commercial & industrial loans. In seven months through February, year-over-year, they contracted in three. Prior to this, the last negative month was in October 2010.
So makes you wonder, what is driving the Fed? Asset inflation? Or are they just looking to build a buffer, just so their monetary quiver is not without arrows when the next downturn hits?
More important perhaps is, will the jawboning work this time? It did this month, when markets went from 30-plus percent odds of a March hike to a near certainty in a matter of a few days. Equities took the hike in stride. But would they continue to if there are three more this year? We will find out once we begin to hear more Fed officials talk up ‘three more hikes’.
30-year bond: Currently net short 20.4k, down 33.6k.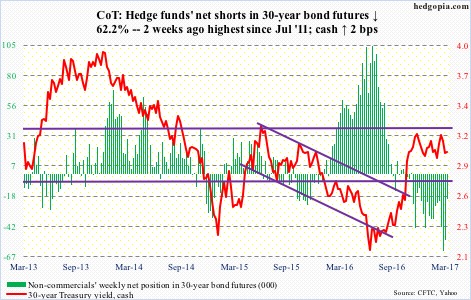
Major economic releases next week are as follows.
March’s ISM manufacturing index is scheduled for Monday. Manufacturing activity has picked up – from 49.4 last August to 57.7 in February, a 30-month high – and probably needs a breather.
Revised estimates of February’s durable goods data, plus non-durable, are due out on Tuesday. Preliminarily, orders for non-defense capital goods ex-aircraft – proxy for business capital expenditures – rose 2.7 percent year-over-year to a seasonally adjusted annual rate of $64.6 billion. This was the third straight y/y increase, following 13 months of contraction. Orders peaked at $70.7 billion in September 2014.
March’s ISM non-manufacturing index plus FOMC minutes for the March 14-15 meeting come out Wednesday. Services activity in February was at a 16-month high, and orders at an 18-month high.
Friday brings March’s employment data. January and February averaged 237,000 non-farm jobs. The pace likely is not sustainable. Last year, the monthly average was 187,000, slower than 226,000 in 2015 and 250,000 before that in 2014.
Crude oil: Currently net long 411.4k, down 23.6k.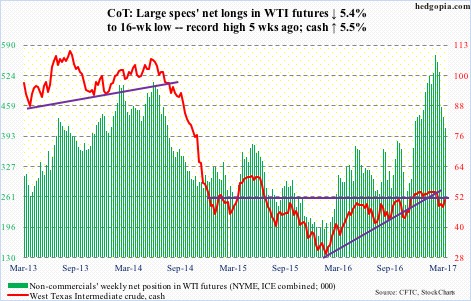
The $47 level on spot West Texas Intermediate crude was tested again Monday, and held. In the prior nine sessions, it was hit twice. The rally subsequent to this week’s test pushed the crude back above the 200-day moving average, rallying 2.4 percent on Wednesday alone. The EIA report out that day showed crude stocks continued to build, even as gasoline and distillate stocks continued to drop.
In the week ended March 24, U.S. crude inventory increased 867,000 barrels to 534 million barrels – yet another record.
Gasoline and distillate stocks fell by 3.7 million barrels to 239.7 million barrels and by 2.5 million barrels to 152.9 million barrels, respectively. In the last six weeks, gasoline inventory declined by 19.3 million barrels, and in the last seven distillates by 17.8 million barrels.
Crude imports fell, too, by 83,000 barrels per day to 8.2 million b/d. And refinery utilization increased 1.9 percentage points to 89.3 percent – a 10-week high.
In the meantime, crude production rose 18,000 b/d to 9.1 mb/d. Since OPEC reached a cutback agreement late November last year, U.S. production has gone up by nearly 450,000 b/d.
As for the WTI ($50.60), there is room for it to continue higher – as long as $47 remains intact, that is. Resistance is heavy at $51-$52. The 50-day lies at $51.72.
E-mini S&P 500: Currently net long 160.8k, up 71.6k.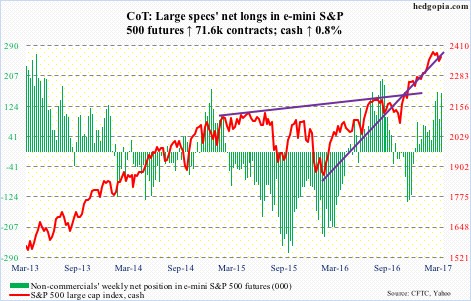
After a slight intraday breach Monday, the 50-day moving average was defended on the cash. This was the first test post-election, and bulls likely would not give up that easy. And they did not.
This preceded a four-week, 3.3-percent drop in the cash (from intraday high to low).
If it can clear 2370, there is room for the index (2362.72) to push higher. A test of the declining trend line from March 1 lies at 2375. March, down 0.04 percent, produced a spinning top.
For now, flows are cooperating.
In the week ended Wednesday, SPY, the SPDR S&P 500 ETF, took in $1 billion (courtesy of ETF.com). And U.S.-based equity funds attracted $1.8 billion (courtesy of Lipper).
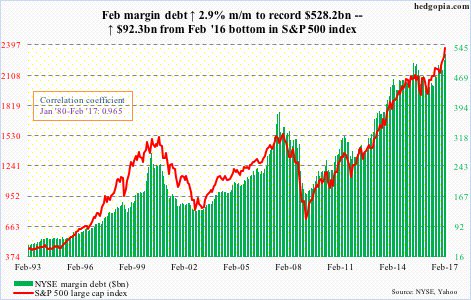
Incidentally, margin debt jumped to a fresh high in February – up $14.9 billion m/m to $528.2 billion. Since February last year, it is now up $92.3 billion. The S&P 500 rallied nearly 33 percent from those lows.
Euro: Currently net short 7.9k, down 11.7k.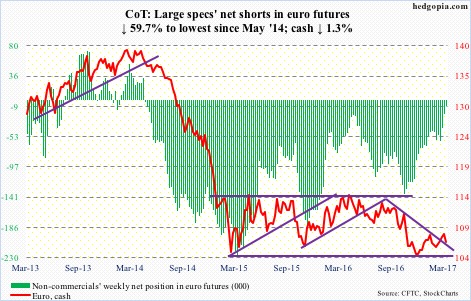
Briefly for a day or two, the cash (106.58) broke out of its inverse head-and-shoulders formation, but only to be rejected at the 200-day moving average, which is still declining.
Monday’s 109.06 high also tagged the declining trend line from last May. In the next couple of sessions, the currency was pushed back below resistance-turned-support at 108-plus. The path of least resistance is down unless that level is recaptured. Friday, the 50-day was slightly breached.
A rising trend line from January 3 low gets tested around 106.25.
Gold: Currently net long 137.8k, up 21.6k.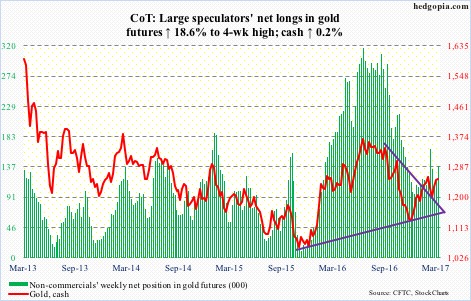
Once again, the 200-day moving average came in the way of the cash, having rallied to $1,261.4 Tuesday before retreating. Same thing happened on February 27 when gold rallied to $1,264.9.
The yellow metal ($1,251.20) is caught between 50- and 200-day. Daily conditions are overbought. A test of the 50-day ($1,228.82) looks likely.
In the week ended Wednesday, GLD, the SPDR gold ETF, lost $36 million (courtesy of ETF.com).
Nasdaq 100 index (mini): Currently net long 85.3k, up 9.2k.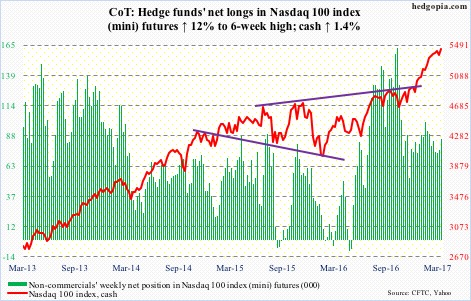
Yet another week and yet another high for the cash. Large-caps continue to drive action. Of the top five Nasdaq 100 weights, barring Alphabet (GOOGL), the remaining four – Apple (AAPL), Facebook (FB), Amazon (AMZN) and Microsoft (MSFT) – all rose to fresh all-time highs.
In the week ended Wednesday, QQQ, the PowerShares Nasdaq 100 ETF, pulled in $1.2 billion (courtesy of ETF.com).
Early in the week, the index came very close to developing a cross-under between 10- and 20-day moving averages, but was denied. It pushed off of the daily lower Bollinger band, now it is kissing the top end. The 10/20 cross-down can still happen. Both averages are now flattish.
Russell 2000 mini-index: Currently net short 56.3k, up 14.1k.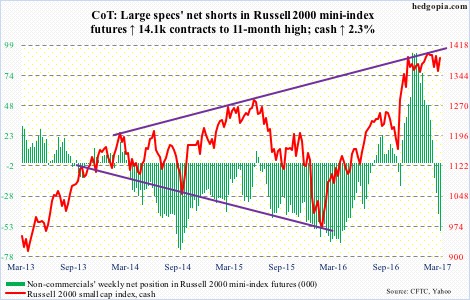
Bulls’ dogged determination not to let go of range support paid off. Except for minor breaks – both up and down – the cash has been stuck between 1392 and 1347 for nearly four months now.
This week’s rally started Monday when the index hammered out a hammer session. The subsequent rally not only recaptured the 50-day moving average but also a declining trend line from March 1.
Short interest on IWM, the iShares Russell 2000 ETF, probably helped. Mid-March, it stood at 108.1 million, down 8.1 percent period-over-period but up 15.3 percent from mid-January. Depending on how things transpire around 1392, shorts can get active again. This resistance has proven tough to crack. Friday, the index (1385.92) rallied to 1390 and sellers showed up in the last half an hour.
At least going by the first two sessions of the week, IWM longs took the rally as an opportunity to exit. The ETF lost $481 million in those sessions – and $240 million in the week ended Wednesday (courtesy of ETF.com).
March, down 0.06 percent, produced a long-legged doji after four positive months.
US Dollar Index: Currently net long 44.2k, down 2.1k.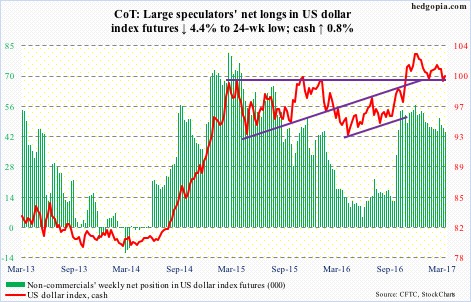
The cash rallied 0.3 percent on Wednesday, likely responding to interest-rate comments from Mr. Rosengren and Mr. Williams. A day earlier, it rallied 0.6 percent when Mr. Fischer spoke.
Monday, it just about tested the 200-day moving average. The low in that session (98.67) tagged the rising trend line from last May. Odds favor the dollar index (100.22) continues to rally – at least near term.
A crucial test lies ahead. The 50-day rests at 100.59, which is where horizontal resistance from March 2015 lies, and above that lies 102.
VIX: Currently net short 102.8k, down 10.7k.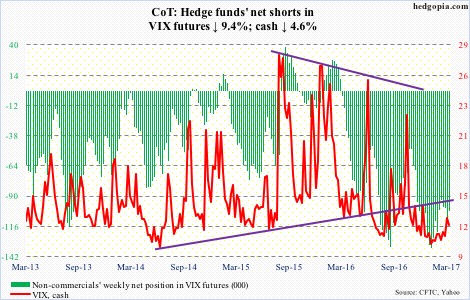
Intraday, the cash lost four points in three sessions. The high of 15.11 was scored Monday, when early strength was sold hard, and when the 200-day moving average was first won and then lost. Also in that session, once again using intraday highs, the VIX-to-VXV ratio jumped to 0.97, essentially unwinding the oversold conditions it was in. That set off a rally in equities.
Not surprisingly, in the week ended Wednesday, VXX, the iPath S&P 500 VIX short-term futures ETN, lost $275 million. This followed inflows of $257 million in the prior week (courtesy of ETF.com).
With this, VIX once again dropped to the bottom of a multi-year range – has room to rally on the daily chart.
