
Following futures positions of non-commercials are as of April 18, 2017.
10-year note: Currently net short 41.3k, down 23.2k.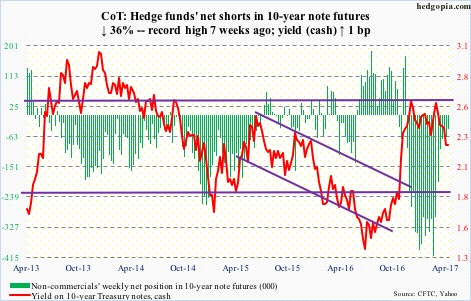
After dropping last week out of a five-month, 2.62 percent-2.31 percent range, 10-year Treasury yields (2.24 percent) proceeded to drop to 2.18 percent this Tuesday before reversing.
The reversal took place at an interesting juncture.
On November 8, the 10-year yielded 1.86 percent, then rallied hard, with two gap-ups in close proximity – one on the 9th and the other on the 14th. This week, yields bounced off of that gap-up support (without filling it).
Gaps in general like to get filled.
For now, as oversold as these yields are, the path of least resistance is up. Right above lies the broken support-turned resistance at 2.31 percent. It is going to be a big test.
The corresponding support on TLT, the iShares 20+year Treasury bond ETF (123.54), rests at just under 122. The same way 10-year yields can head lower to fill the afore-mentioned gap (s), TLT in due course has a shot at 128-plus so it can fill its own gap.
30-year bond: Currently net short 2.4k, down 10.5k.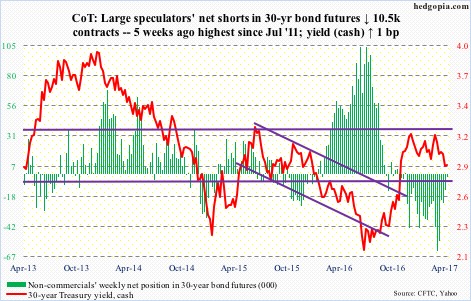
Major economic releases next week are as follows.
Tuesday brings the S&P Corelogic Case-Shiller home price indices (February) and new home sales (March).
Nationally, prices rose 5.9 percent in January – the highest growth rate since June 2014. Prices have been gradually accelerating the past couple of years.
New home sales rose 6.1 percent month-over-month in February to a seasonally adjusted annual rate of 592,000. Sales peaked last July at 622,000 – the highest since 627,000 in January 2008.
Durable goods orders (March) and pending home sales (March) are due out Thursday.
Orders for non-defense capital goods ex-aircraft – proxy for business capital expenditures – rose 2.9 percent year-over-year in February to $64.7 billion (SAAR). This was the 3rd straight y/y increase after 13 straight declines. Orders peaked at $70.7 billion in September 2014.
February pending home sales jumped 5.6 percent m/m to 112.3, which was the highest since a 10-year high 113.6 last April.
GDP (1Q17, advance), the employment cost index (1Q17), and the University of Michigan’s consumer sentiment (April, final) will be reported Friday.
Real GDP expanded 2.1 percent in 4Q16, on par with the post-Great Recession average, but substantially weaker than the 3.2 percent average going back to 1947. The Atlanta Fed’s GDPNow model forecasts 0.5 percent growth in 1Q17.
Compensation costs for private sector workers increased 2.2 percent y/y in 4Q16.
Preliminarily, consumer sentiment rose 1.1 points m/m in April to 98. January’s 98.5 was a 13-year high.
Crude oil: Currently net long 483.3k, up 26.3k.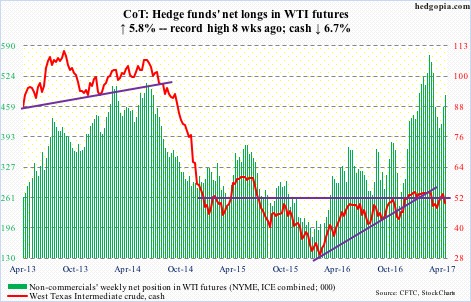
The latest EIA report out Wednesday was not that bad, but spot West Texas Intermediate crude ($49.62) proceeded to lose 3.8 percent in that session, losing support at $51-$52 as well as the 50-day moving average. At Friday’s low, it was merely 0.5 percent from testing the 200-day.
This was preceded by a 13-session (from intraday low to high), 14-plus percent rally through April 12. Digestion was only natural. And it is taking place by giving up a good portion of these gains.
Near-term, risk is of a test of support at $47.
In the week ended April 14, the EIA report showed, U.S. crude stocks fell one million barrels to 532.3 million barrels. This is the second straight week-over-week drop since reaching a record 535.5 million barrels two weeks ago.
Gasoline and distillate stocks went separate ways, with the former rising 1.5 million barrels to 237.7 million barrels and the latter dropping two million barrels to 148.3 million barrels.
Refinery utilization rose 1.9 percentage points to 92.9 percent – a 14-week high.
Crude imports fell – by 68,000 barrels per day to 7.8 million b/d. Production, on the other hand, continued to inch higher – up 17,000 b/d to 9.3 mb/d. Since OPEC reached a cutback agreement late November last year, U.S. production has gone up by north of 500,000 b/d.
E-mini S&P 500: Currently net long 134.2k, up 13.3k.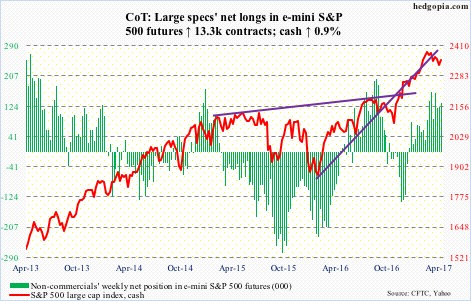
Although the cash has remained under the 50-day moving average for seven straight sessions, it never undercut the March low of 2322.25. The average also coincides with a declining trend line from March 1 when the index rallied to an intraday high of 2400.98.
A takeout of this resistance will make way for another test – 2370, which goes back a couple of months and which is where the daily upper Bollinger band rests.
At least until Wednesday, flows into SPY, the SPDR S&P 500 ETF, were not cooperating – down $747 million in that week (courtesy of ETF.com).
In the same week, U.S.-based equity funds attracted $866 million (courtesy of Lipper).
Euro: Currently net short 21.6k, up 2.7k.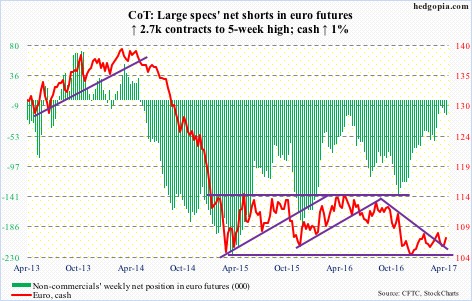
A Thursday poll showed centrist candidate Emmanuel Macron will win the French presidential election. If he wins, the ECB can come under pressure to at least begin to unwind its QE, and Eurozone rates could head higher. Of late, in the aggregate, Eurozone macro data have been coming in stronger than expected. This, at least in theory, is euro positive.
The currency likely will react adversely if Jean-Luc Melenchon (far left) and Marine Le Pen (far right) finish in the top two in this Sunday’s voting. The run-off is scheduled for May 7.
For now, the euro (107.25) is caught between a rising trend line from January 3 this year and resistance at 108.50. The latter represents a confluence of a declining trend line from May last year, horizontal resistance going back two years, and the 200-day moving average.
Gold: Currently net long 195.8k, up 23.1k.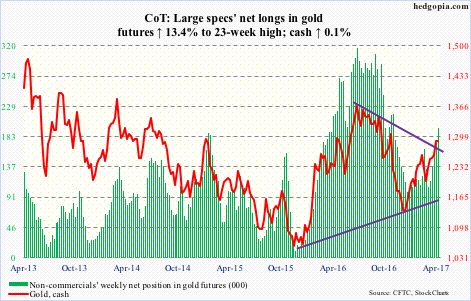
There was resistance on the cash at the $1,300 level. Monday, in a long-legged doji session the metal retreated after rallying to $1,297.4 – preceded by a doji in the prior session.
From March 10 through that high, gold ($1,289.1) added just north of $100. The daily chart in particular remains overbought. For its own good, the metal probably needs to test the 200-day moving average ($1,259.38). For a month and a half beginning late February, the average repelled several breakout attempts, so is bound to stage a tug of war between bulls and bears.
The rising 50-day rests at $1,245.58.
Nasdaq 100 index (mini): Currently net long 105.8k, up 8.1k.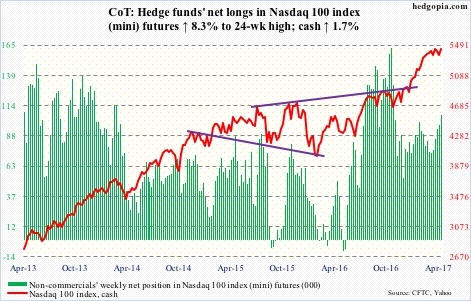
Last week, for the first time this year the still-rising 50-day moving average on the cash was tested, and defended. The index once again is testing one-plus month resistance. Non-commercials have been adding as if it is only a matter of time it gave way.
Flows continue to play hide and seek.
In the week ended Wednesday, QQQ, the PowerShares Nasdaq 100 ETF, lost $358 million. This followed inflows of $409 million in the prior week (courtesy of ETF.com).
Russell 2000 mini-index: Currently net short 72.2k, up 13.8k.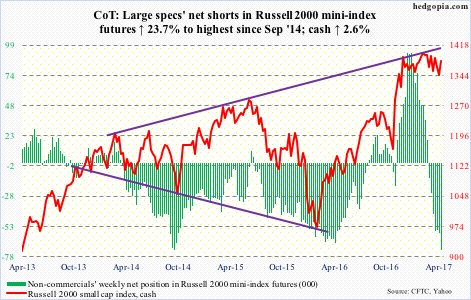
After getting rejected at the 50-day moving average in three straight sessions last week, the cash then dropped to the bottom of a nearly five-month range.
The subsequent bounce off of that support not only broke past that average but also a declining trend line from the all-time high on March 1 (1414.82).
The top of the range is merely 0.9 percent away, where shorts can get active. Until proven otherwise, shorting range resistance and buying support has worked like a charm.
In the week ended Wednesday, IWM, the iShares Russell 2000 ETF, lost $340 million. This was the fourth straight weekly loss during which $3.1 billion left (courtesy of ETF.com).
US Dollar Index: Currently net long 43.4k, down 898.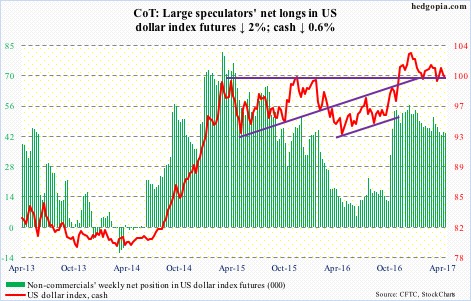
The neckline of a head-and-shoulders formation on the cash was just about tested Thursday when it hit 99.29. The index has been under pressure since rallying to 101.27 to kiss the upper Bollinger band eight sessions ago.
In the days ahead, worse, the dollar index drops to test the 200-day moving average (98.91), which also approximates the aforementioned neckline – a must-hold, and likely does not give way. Daily conditions are oversold.
VIX: Currently net short 85.6k, up 2k.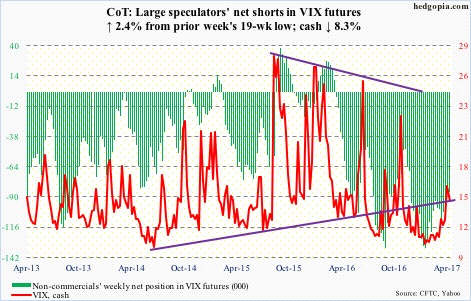
The week started with a large reversal candle on the cash. This preceded a 49-percent rally in eight sessions (from intraday low to high). The resulting overbought conditions are being unwound, but volatility bulls are not giving up easy.
Real test lies ahead. The 200-day moving average (13.05) is 1.58 points away. After that comes the rising 50-day (12.40). In the weeks ahead, there likely is a golden cross in the making – potentially bullish for volatility.
Inability to save these two averages opens the door for a drop to the bottom of the multi-year range the cash has been in.
In this scenario, the VIX-to-VXV ratio continues to unwind its overbought conditions. Last week, it closed at 1.01, dropping to .99 this week. Prior to the recent jump, the ratio lingered in high-.70s/low-.80s for weeks.
