
Following futures positions of non-commercials are as of May 2, 2017.
10-year note: Currently net long 179.9k, down 34.8k.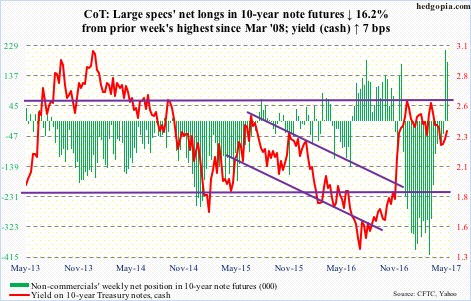
Pre-FOMC decision this week, futures were pricing in 63 percent odds of a 25-basis point hike in June and 60 percent in July. Post-FOMC, June rose to 79 percent by Friday, and July to 74 percent.
Markets have decided that the Fed is determined about its hiking plan. The latter has told us that it would like to move at least two more times this year. This week’s FOMC statement did not signal any change in this posture.
The statement essentially said the recent softness in data is temporary and will pass. Friday’s April jobs report was vindication. Sort of. Most other data lean on the softer side.
To recall, 1Q17 real GDP printed sluggish 0.7 percent growth. Core consumer inflation (both personal consumption expenditures and consumer price index) is decelerating. The ISM manufacturing index fell 2.4 points month-over-month in April to 54.8, with February’s 30-month high 57.7 likely a peak for a while.
So unless they have a very good reason not to move, June seems like a lock. The 13-14 meeting also has a press conference scheduled. A 25-basis-point hike puts the fed funds rate at 113 basis points. This probably is not enough of a buffer for the Fed to begin to taper its $4.5-trillion balance sheet.
In the meantime, the long end of the curve continues to express its displeasure. The yield curve (10-2s) is tighter than in December 2015, when the Fed hiked for the first time since June 2006. There have been two more hikes since.
The recent rout in commodities agrees with the message coming from the yield curve.
30-year bond: Currently net long 9.2k, down 11.4k.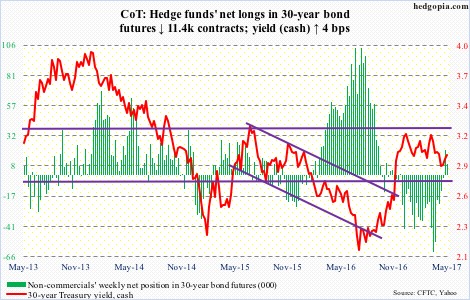
Major economic releases next week are as follows.
Tuesday brings the NFIB optimism index (April) and JOLTS (March).
Small-business optimism jumped post-election last year. March was down six-tenths of a point m/m to 104.7, but the prior three months were north of 105. January’s 105.9 was the highest since 106.1 in December 2004.
Non-farm job openings rose 118,000 m/m in February to 5.74 million. Openings peaked last July at 5.97 million, which was essentially flat with 5.89 million in July 2015 and 5.85 million last March.
April’s PPI-FD is scheduled for Thursday. Producer prices slipped 0.1 percent m/m in March, but jumped 2.3 percent in the 12 months through March. Core PPI rose 0.1 percent m/m in March and 1.7 percent in the 12 months through March.
CPI (April), retail sales (April) and the University of Michigan’s consumer sentiment (May, preliminary) are on tap for Friday.
Consumer prices fell 0.3 percent m/m in March and rose 2.4 percent in the 12 months through March. Core CPI, too, inched down 0.1 percent m/m in March while increasing at two percent in the 12 months through March. This was the 17th consecutive month of growth of two percent or higher year-over-year.
March retail sales fell 0.2 percent m/m to a seasonally adjusted annual rate of $470.8 billion. They rose 5.2 percent y/y.
Consumer sentiment inched up one-tenth of a point to 97 in April. The post-election surge peaked at 98.5 in January – a 13-year high.
Crude oil: Currently net long 407.2k, down 34.4k.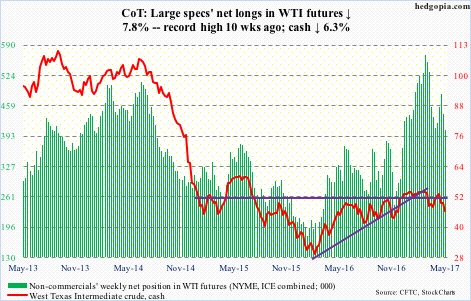
From the inventory perspective, the latest EIA report saw improvement, but oil bulls were unable to cash in. Wednesday, the day the report came out, spot West Texas Intermediate crude inched up 0.3 percent, but momentum was already down, having lost the 200-day moving average Monday.
Come Thursday, it collapsed 4.8 percent, losing support at $47 and change. The intraday low of $45.29 in that session matched the pre-OPEC agreement close of $45.23. Friday’s reversal candle in which the crude dropped to $43.76 intraday before closing up 1.5 percent to $46.22 essentially tested support at $43 – so far successfully.
In the week ended April 28, Crude production continued to inch higher – up 28,000 barrels/day to 9.3 million b/d. Since OPEC reached a cutback agreement late November last year, U.S. crude production has increased by just under 600,000 b/d.
U.S. crude stocks fell 930,000 barrels to 527.8 million barrels. This was the fourth straight week-over-week drop since reaching a record 535.5 million barrels four weeks ago.
Distillate inventory dropped 562,000 barrels to 150.4 million barrels. Gasoline stocks, however, rose 191,000 barrels to 241.2 million barrels – a six-week high.
Crude imports dropped 648,000 b/d to 8.3 mb/d. The prior week was an 11-week high.
Refinery utilization fell eight-tenths of a point to 93.3 percent. The prior week’s 94.1 percent was the highest since late November 2015.
E-mini S&P 500: Currently net long 91.5k, down 30.6k.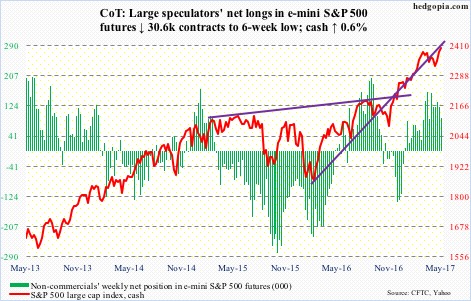
After three weeks of inflows totaling $9.5 billion, U.S.-based equity funds lost $3.7 billion in the week to Wednesday (courtesy of Lipper).
In the same week, SPY, the SPDR S&P 500 ETF, saw redemptions of $3.9 billion (courtesy of ETF.com).
Nonetheless, amidst earnings, the S&P 500 (cash) hung tough, bouncing off the 10-day moving average three times, and closing Friday right underneath March 1 high.
Euro: Currently net short 1.7k, down 19.2k.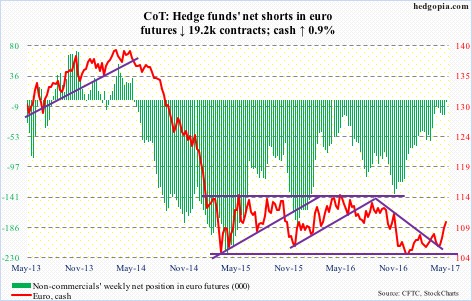
The Eurozone of late has been printing stronger-than-expected numbers. IHS Markit’s composite PMI for April, for instance, rose to a six-year high 56.8.
The ECB is yet to react to it. Beginning April, it cut its monthly purchases of securities from €80 billion to €60 billion, but this still comprises tons of stimulus. The QE runs through the end of the year.
It is possible the bank will change its posture after the second round of French elections this Sunday – assuming Emmanuel Macron wins, of course.
The euro (cash) acts like it expects one. Last week, it rallied past resistance at 108-plus as well as the 200-day moving average. This week, the currency (109.96) rallied another 0.9 percent. A falling trend line from August 2015 extends to 111 – hence potential resistance.
Gold: Currently net long 189.6k, down 11k.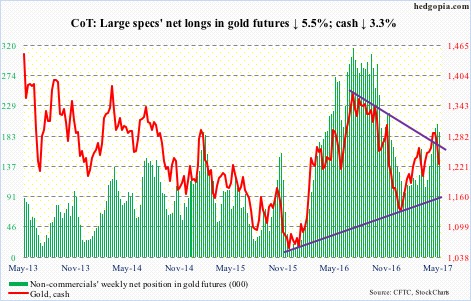
Commodities took it on the chin this week. Gold (cash) was no exception, losing both 50- and 200-day moving averages.
On April 17, the metal ($1,226.90) rallied to $1,297.40 before getting rejected by a falling trend line from September 2011 when it peaked at $1,923.70. A breakout would have been a major development.
There is decent support at $1,180-$1,190.
In the week ended Wednesday, GLD, the SPDR gold ETF, lost $36 million (courtesy of ETF.com).
Nasdaq 100 index (mini): Currently net long 105.8k, down 8.7k.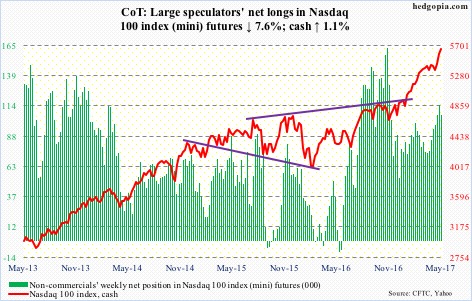
In the week through Wednesday, QQQ, the PowerShares Nasdaq 100 ETF, gained another $1.4 billion. This followed inflows of $336 million in the prior week (courtesy of ETF.com).
The cash kept rising this week but is showing some signs of fatigue. That said, the index (5646.09) is still above shorter-term moving averages, which are still rising. Total risk-on as far as tech stocks are concerned.
In due course, at least a retest of the April 20th breakout is likely – 3.8 percent away. This also approximates the 50-day moving average.
Russell 2000 mini-index: Currently net short 12.2k, down 18.2k.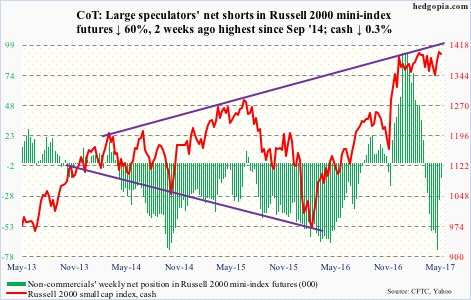
Thursday, the cash (1396.99) came within 0.1 percent of testing the 50-day moving average (1378.72) before bouncing. This preceded a false breakout eight sessions ago, followed by a new high of 1425.70 on April 26.
A loss of the 50-day would probably ensure the index drops – once again – toward a five-plus-month range. Bulls have persistently defended 1340s.
In the week ended Wednesday, IWM, the iShares Russell 2000 ETF, took in $561 million, following inflows of $2.6 billion in the prior week (courtesy of ETF.com).
US Dollar Index: Currently net long 40k, down 3.5k.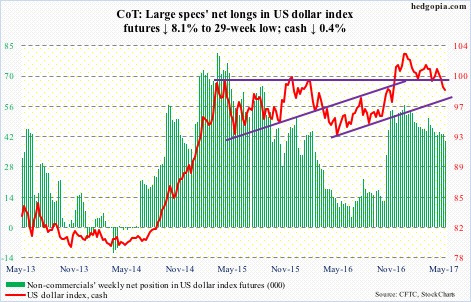
The cash has stopped responding to the shorter end of the Treasury yield curve. The Fed funds rate has gone up 75 basis points since December 2015, with more hikes probably on the way.
After rallying nearly 26 percent in nine months to 100.71, the dollar index peaked in March 2015. That high has proven to be an important level. The last time the index got rejected at that resistance was a month ago.
This week, it continued to hover around its 200-day moving average before ending the week 0.5 percent away from it. A couple of weeks ago, the dollar index lost a rising trend line from last May, the underside of which is likely to provide resistance when it rallies.
Kudos to non-commercials for not buying the ‘dollar set to massively rally’ meme that was particularly prevalent last year.
VIX: Currently net short 106.7k, up 37.9k.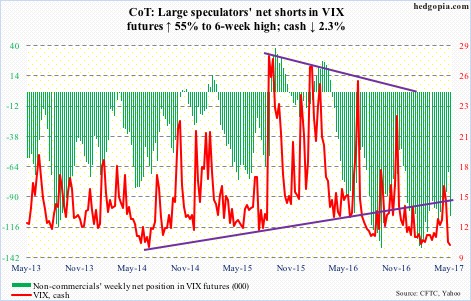
The cash went sub-10 intraday Monday, and again on Friday. This was the first sub-10 reading since February 1 this year. The all-time low of 9.39 was reached in December 2006.
Apparently, it is not often VIX trades sub-nine, or even sub-10 for that matter. From these levels, the path of least resistance is up. The only question is, will it go sideways first or jump right back up?
Thus far, shorter-term daily moving averages are providing resistance. They need to begin to hook up.
In the meantime, using intraday lows, the VIX-to-VXV ratio dropped to 0.792 on Monday. Once again, the question is, will the ratio go sideways in high-.70s/low-.80s for weeks or shoot right back up?
