
Following futures positions of non-commercials are as of May 21, 2019.
10-year note: Currently net short 423.4k, up 70.5k.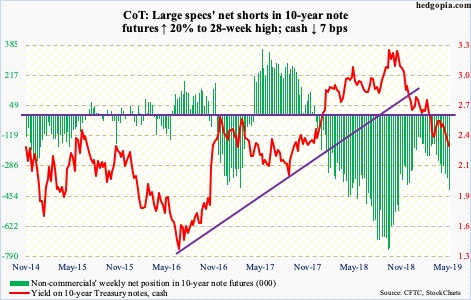
There goes that support. Thursday’s 10-basis-point drop in the 10-year Treasury yield (2.32 percent) sliced right through nine-year support at 2.40 percent. Earlier on Wednesday last week, bears (price) had defended an intraday low of 2.36 percent from late March. The rally since that low stopped right at 2.61 percent mid-April. Going back a decade, 2.62 percent has proven to be an important level. This has been the case particularly since December 2016. A breakout occurred in January last year, and a breakdown this March.
With the rather unexpected loss this week of 2.40 percent, bears now have another level of resistance to worry about. Since the 10-year rate peaked at 3.25 percent last October, there has been a persistent pattern of lower highs and lower lows. Until this changes, it is a losing proposition for non-commercials, who have sizable holdings in net shorts in 10-year-note futures, which rose to a 28-week high this week.
30-year bond: Currently net short 44k, down 1.9k.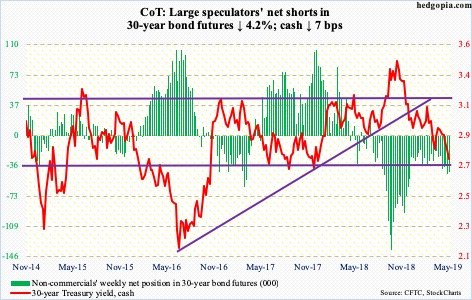
Major economic releases next week are as follows. Markets are closed Monday for observance of Memorial Day.
The S&P Case-Shiller home price index for March is due out Tuesday. Nationally, February home prices rose four percent year-over-year. Growth has decelerated since rising 6.5 percent in March last year.
The second estimate of 1Q19 GDP will be published Thursday. The first print showed real GDP expanded at a 3.2 percent annual clip, matching the long-term average going all the way back to 2Q47, and much faster than the post-Great Recession average of 2.3 percent.
Friday brings personal income (April) and the University of Michigan’s consumer sentiment index (May, final).
In the 12 months to March, core PCE – the Fed’s favorite measure of consumer inflation – rose 1.55 percent, the slowest pace since September 2017. Except for last July, inflation has not grown with a two handle since May 2012.
Preliminarily, consumer sentiment in May jumped 5.2 points month-over-month to 102.4. This was the highest since January 2004.
Crude oil: Currently net long 582.3k, down 10.8k.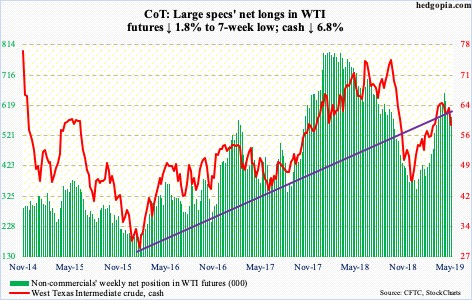
The EIA report for the week of May 17 showed US crude stocks jumped 4.7 million barrels to 476.8 million barrels – the highest since July 2017. Stocks of gasoline and distillates rose, too – up 3.7 million barrels and 768,000 barrels to 228.7 million barrels and 126.4 million barrels, respectively. As did crude production, which increased 100,000 barrels per day to 12.2 million bpd. Refinery utilization inched down six-tenths of a percentage point to 89.9 percent. Crude imports, however, fell 669,000 bpd to 6.9 mbpd.
All in all, oil bulls did not get much help from this report. The cash ($58.63/barrel) fell 2.7 percent Wednesday and then another 5.7 percent Thursday, slicing through support at $60-61 as well as both the 50- and 200-day. There is decent support at $54-55.
E-mini S&P 500: Currently net long 100.8k, up 6.9k.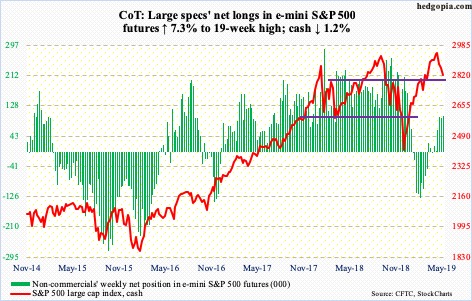
After four weeks of outflows totaling $34.1 billion, US-based equity funds in the week to Wednesday pulled in $2.7 billion (courtesy of Lipper). In the same week, SPY (SPDR S&P 500 ETF), VOO (Vanguard S&P 500 ETF) and IVV (iShares core S&P 500 ETF) gained a combined $2.6 billion (courtesy of ETF.com). In the prior two weeks, these ETFs saw outflows of $12.9 billion. This week’s inflows were before Thursday’s selloff in stocks, including a 1.2-percent drop in the S&P 500.
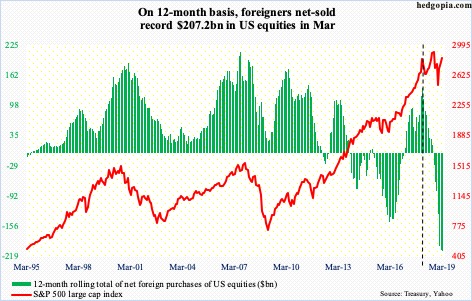
In the meantime, also in the week through Wednesday, US money-market assets reached $3.13 trillion – the highest since March 2010 (courtesy of ICI). This is a headwind for stocks. As is foreigners’ unwillingness to buy. In the 12 months to March, they sold $207.2 billion in US stocks. Domestically, FINRA margin debt rose $14.7 billion in April to $588.7 billion, but the all-time high of $668.9 billion was set as far back as May 2018. The willingness to add to leverage is on the wane.
Similarly, investor sentiment is holding up, but it is nowhere near as ebullient as was the case leading up to selloffs in January and October last year. Buybacks have been a shining light. Even here, with 86 percent of buybacks reported, 1Q19 is on course for $188 billion, down 2.3 percent quarter-over-quarter and up 7.9 percent year-over-year (courtesy of S&P Dow Jones Indices). Things can always change, of course. Foreigners, for instance, can start buying and assets can flow out of money markets into stocks. But right at this minute, these are all headwinds.
The cash (2826.06) peaked as soon as May began at 2954.13. It is currently sandwiched between the 50- and 200-day moving averages. There is a fierce battle going on between bulls and bears over control of 2800, which has proven to be an important price point going back to March 2018. Thursday, bulls once again stepped up to defend 2800 – the second successful defense in the last couple of weeks. But the longer bears keep hammering on this, it risks giving way sooner or later. Weekly overbought conditions have room for continued unwinding.
Euro: Currently net short 101.1k, up 5.8k.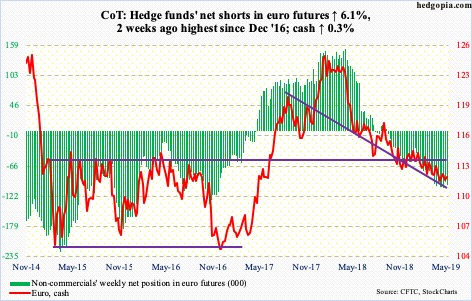
Thursday, the cash ($112.02) fell to a two-year low of $111.08 but not before buyers showed up to hammer out a potentially reversal candle. The daily is oversold. The 50-day ($112.35), which continues to drop, has resisted rally attempts the past three months. More important, the euro peaked at $125.37 in January last year and has since made lower highs. Immediately ahead, the issue is whether or not bulls will be able to force a higher high. Two weeks ago, the currency retreated after tagging $112.63.
Gold: Currently net long 88.8k, down 35.7k.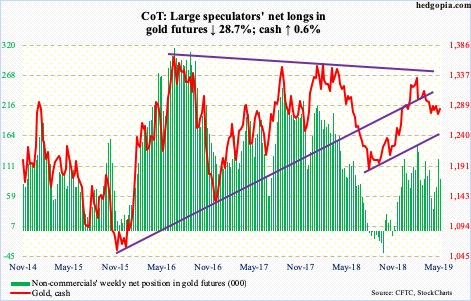
After seven consecutive weeks of outflows totaling $2.1 billion, GLD (SPDR gold ETF) in the week to Wednesday took in $231 million; IAU (iShares gold trust) lost $36 million (courtesy of ETF.com).
The cash ($1,283.60/ounce) Tuesday successfully tested $1,260s. This was the third time in the past month bids showed up around that level. The daily has room to continue higher. The 50-day lies at $1,291.22. After that lies resistance at $1,300, which gold bugs were unable to take out nine sessions ago.
Nasdaq 100 index (mini): Currently net long 13k, up 1.5k.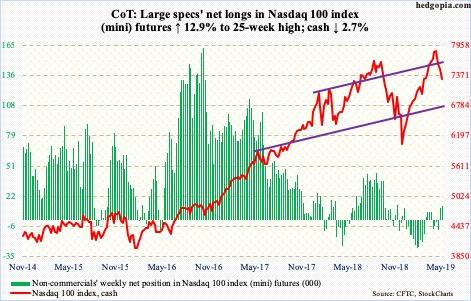
In the week through Wednesday, QQQ (Invesco QQQ trust) attracted $664 million, reversing outflows the prior three weeks totaling $2.8 billion (courtesy of ETF.com). This was prior to Thursday’s 1.5-percent drop in the cash (7300.96). In fact, intraday that session the Nasdaq 100 was down as much as 2.1 percent, undercutting the low from nine sessions ago. For the week, it dropped 2.7 percent.
Weekly momentum indicators continue lower. But the daily is beginning to get oversold. There is decent support at 7200, with the 200-day (7156.06) right underneath.
Russell 2000 mini-index: Currently net short 14.7k, up 6.3k.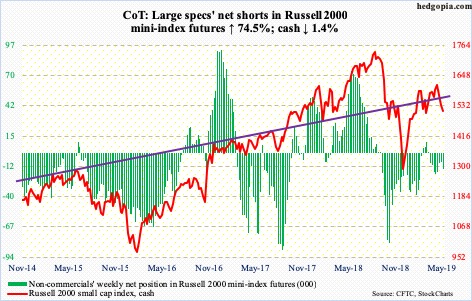
Intraday Thursday, the cash (1514.11) slightly breached the prior low of March 25, but nothing major. Small-cap bulls cannot afford to allow a lower low. A break of this support exposes the Russell 2000 to 1450s. In the past three months, despite repeated attempts, bulls failed to break through 1600-plus. The index peaked as early as last August at 1742.09. If small-caps are treated as a barometer of risk-on, it is missing currently.
Medium term, more downward pressure is likely. Near term, the daily is getting oversold, creating an opportunity for bulls to step up. Perhaps in anticipation of this, IWM (iShares Russell 2000 ETF) and IJR (iShares core S&P small-cap ETF) in the week ended Wednesday took in $1 billion (courtesy of ETF.com).
In the event of a rally near term, the 50- and 200-day lie in 1550s-60s.
US Dollar Index: Currently net long 26.7k, up 35.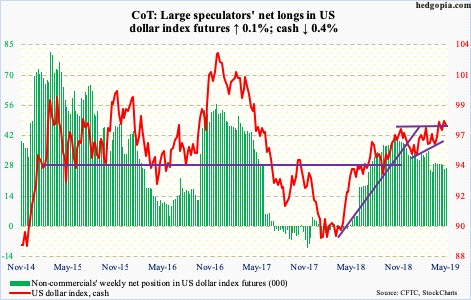
Thursday, the cash (97.48) rose to a two-year high of 98.26 but only to reverse hard, ending with a candle with a long wick. This was preceded by last week’s breakout at 97.50s, which dollar bulls will now be struggling to save. The daily is extended. The 50-day lies at 96.98, which also approximates the daily lower Bollinger band. Worse, the 200-day is at 96.15. A rising trend line from last September also converges there, so it is a must-save.
VIX: Currently net short 105.3k, up 15.6k.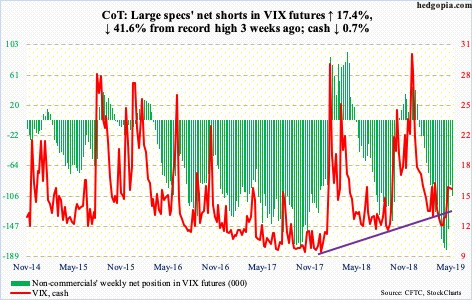
Thursday, the S&P 500 just about tested the low from nine sessions ago – 2805.49 versus 2801.43 – yet volatility was nowhere near the high from May 9. Back then, VIX retreated after hitting an intraday high of 23.38. Thursday, it closed up 2.17 points to 16.92, with a high of 18.05. In the right circumstances for volatility bulls, should VIX (15.85) proceed toward the high from two weeks ago, stocks likely take another leg lower. In this scenario, 2800 on the S&P 500 likely gives way, taking out stops. This could then also mean an opportunity to go long for at least a trade.
The 21-day moving average of the CBOE equity-only put-to-call ratio closed Friday at 0.6844, up from 0.5962 on April 30. Historically, the ratio tends to revert from high-0.60s/low-0.70s. A drop in the ratio should coincide with a rise in stocks.
Thanks for reading!
