
Following futures positions of non-commercials are as of July 9, 2019.
10-year note: Currently net short 288.8k, down 48.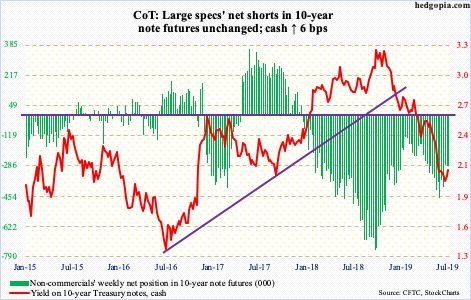
In the first stare down with markets since his appointment in February last year, Jerome Powell, Fed chair, blinked. In this week’s semi-annual Humphrey-Hawkins testimony, he all but said a cut in the fed funds rate is coming later this month. The FOMC meets on 30-31. Ahead of his Congressional appearance, fed funds futures were 100 percent certain of a 25-basis-point cut, to 200-225 basis points. But after a much-better-than-expected June jobs report, there was speculation that maybe he would signal he would want to wait for more clarity. That did not happen. This is not a Fed – neither was Janet Yellen, or Ben Bernanke, or even Alan Greenspan-led – that would dare rock the markets boat, no matter how ridiculous the latter’s wishes. They are all bound by the wealth effect. For all intents and purposes, financial markets have become the third mandate – besides the Congressionally mandated maximum employment and price stability.
The need for a cut at this point in time is particularly baffling considering that the Fed’s monetary quiver does not have enough arrows to fight the next recession. Yes, it has been a decade since Great Recession, and the economy is showing signs of wear and tear. That said, with the unemployment rate near a five-decade low, it is far from falling apart. So why fire the scarce arrow now? It is possible the Fed – and other major central banks – have convinced themselves they have the powers to stop economic contraction, and that the business cycle was dead. Forget the fact that it is because of this easy-money-can-treat-anything attitude, particularly post-financial crisis, that zombies have grown by leaps and bounds. Or, maybe because of this very fact these banks know how vulnerable things are and are doing their best not to let the economies slide into another downturn.
30-year bond: Currently net short 11.2k, up 11.8k.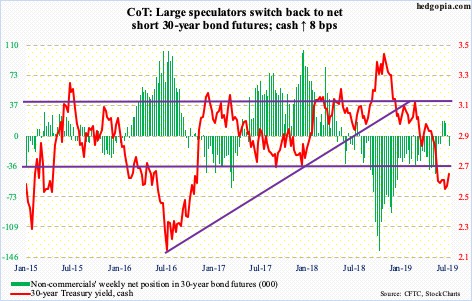
Major economic releases next week are as follows.
Tuesday brings retail sales (June), industrial production (June), the NAHB housing market index (July) and TIC data (May).
May retail sales rose 3.2 percent year-over-year to a seasonally adjusted annual rate of $519 billion.
Capacity utilization in May edged up 0.2 percent month-over-month to 78.1 percent. Last November’s 79.6 percent was the highest since May 2008.
Builder sentiment dropped two points m/m in June to 64. Sentiment reached as high as 74 in December 2017, which was the highest since July 1999.
In the 12 months to April, foreigners net-sold $214.2 billion in US equities – a new record.
Housing starts (June) are due out Wednesday. May was down 0.9 percent m/m to 1.27 million units (SAAR). The cycle high 1.34 million was reached in January this year.
The University of Michigan’s consumer sentiment index (July, preliminary) will be published Friday. Consumer sentiment fell 1.8 points m/m in June to 98.2.
Crude oil: Currently net long 561.2k, down 1.6k.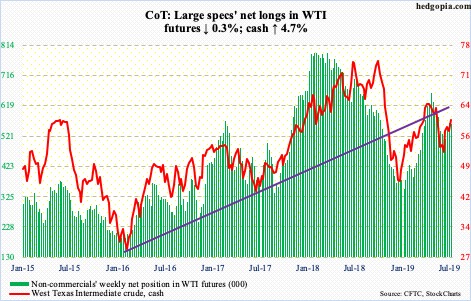
More than a fifth of global oil supply flows through the Strait of Hormuz. There are no other practical shipping alternatives. The ongoing tensions around this chokepoint are helping crude oil rally. Plus, oil production in the Gulf of Mexico is being impacted by Tropical Storm Barry. The cash ($60.21/barrel) rallied 4.7 percent this week, past both 50- and 200-day moving averages, but once again a falling trend line might come in the way.
WTI peaked at $66.60 in April and at $76.90 last October before that. A trend line from those highs was tested this week. Thursday, the crude retreated slightly after rising intraday to $60.94. A breakout opens the door to $63-64. But the daily is getting extended.
Until last week, Barry had no impact on US production. The EIA report for the week of July 5 showed crude production rose 100,000 barrels per day to 12.3 million bpd. Distillate stocks rose as well, up 3.7 million barrels to 130.5 million barrels. Stocks of crude and gasoline, however, fell by 9.5 million barrels and 1.5 million barrels to 459 million barrels and 229.2 million barrels respectively. Crude imports dropped 283,000 bpd to 7.3 mbpd. Refinery utilization increased five-tenths of a percentage point to 94.5 percent.
E-mini S&P 500: Currently net long 17.2k, down 35.9k.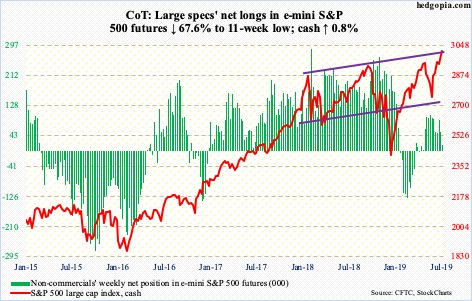
The cash (3013.77) is rallying along a rising trend line from January last year when it retreated after hitting 2872.87. Then last September, the S&P 500 index came under severe pressure after tagging 2940.91, followed by 2954.13 this April. Friday, it rallied to a new intraday high of 3013.92.
The daily has been in overbought territory. Now, the weekly is beginning to get extended. If weakness develops, bulls will try to defend both 10- and 20-day, which are both rising. Immediately ahead, short-term horizontal support lies at 2950s-60s. The 2Q earnings season begins next week.
For a change, in the week to Wednesday, US-based equity funds gained $1 billion (courtesy of Lipper). This was preceded by three weeks of outflows totaling $27.8 billion. In the same week, SPY (SPDR S&P 500 ETF), VOO (Vanguard S&P 500 ETF) and IVV (iShares core S&P 500 ETF) gained a combined $4.7 billion (courtesy of ETF.com).
Euro: Currently net short 35.9k, up 4.1k.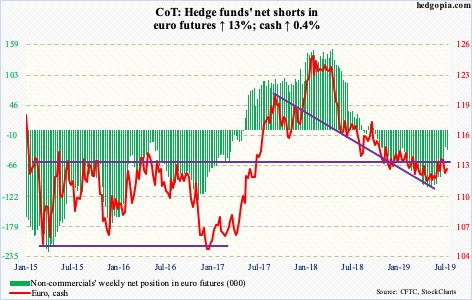
Bulls defended $112 on Tuesday. Since late April, the cash ($112.79) has made higher lows. The 50-day is slightly rising. For now, it is going to be a battle between the daily and weekly. The former has room to unwind its oversold condition and the latter its overbought condition. If the daily wins out, nearest resistance lies at the 200-day ($113.39), followed by headwind just north of $114. On June 24, the euro retreated after touching $114.06.
Gold: Currently net long 244.8k, down 14.2k.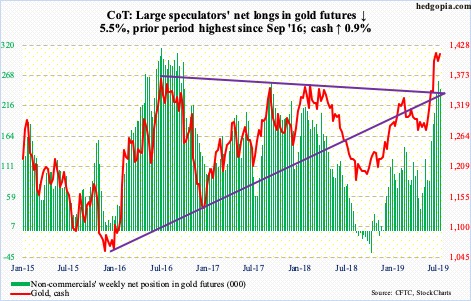
The cash ($1,412.20/ounce) tried to rally on the Humphrey-Hawkins testimony, but not much progress was made. Gold reached a high of $1,442.90 on June 25 and has pretty much gone sideways since, with the 10- and 20-day providing support underneath.
Flows continue to cooperate. In the week to last Wednesday, GLD (SPDR gold ETF) took in another $104 million; in the prior seven, it gained $2.8 billion. IAU (iShares gold trust), however, lost $9 million, breaking a streak of three positive weeks during which it gained $603 million (courtesy of ETF.com).
A real test of these inflows likely takes place when breakout retest occurs at $1,350s-1,360s. The metal broke out mid-June. It is possible gold bugs will use that as an opportunity to add to longs. Time will tell. For now, signs of fatigue are appearing. In the week the yellow metal rallied to $1,442.90, a weekly shooting star formed. This was followed by a weekly long-legged doji. This week, a spinning top showed up with long tails.
Nasdaq 100 index (mini): Currently net long 17.9k, down 6.7k.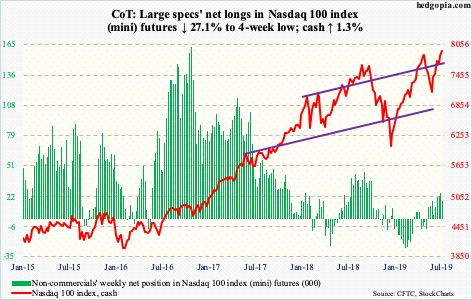
The cash (7943.24) Friday trudged to yet another intraday high of 7944.08. Immediately ahead, bulls need to be able to defend 7850s. After that come shorter-term averages, which are rising – sharply at that. Until these levels give way, bears will continue to be on the back foot.
In the week to Wednesday, QQQ (Invesco QQQ trust) lost $143 million. In the prior week, $2.6 billion was withdrawn (courtesy of ETF.com).
Russell 2000 mini-index: Currently net short 80.6k, up 5.8k.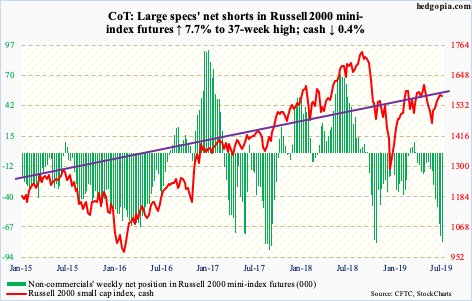
After last week’s weekly long-legged doji, the cash (1570) this week gave back 0.4 percent, although bulls defended the 20-day. In the week to Wednesday, flows were decent, but to no avail. IWM (iShares Russell 2000 ETF) took in $482 million, while IJR (iShares core S&P small-cap ETF) lost $27 million (courtesy of ETF.com).
In the aggregate – versus large-caps in particular – small-caps have not gotten much love. This is unlikely to change until bulls take out 1600 on the Russell 2000. Should that come to pass, non-commercials, too, can possibly begin to cut back their net shorts. Until then, laggards remain laggards.
US Dollar Index: Currently net long 27.1k, up 4.6k.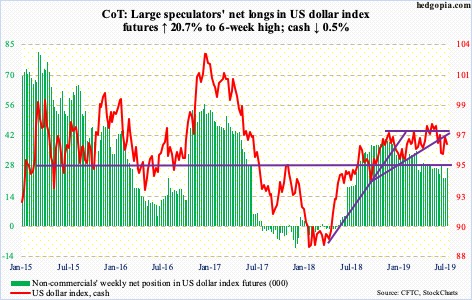
Tuesday’s rally past the 50-day was short-lived. Both Wednesday and Thursday, as Mr. Powell appeared before Congress, the cash (96.42) came under pressure. Dollar bulls defended the 200-day on Thursday, only to then close right on it Friday. Once again, the broken trend line from last September, which was recaptured last week, is in play. The daily looks to be itching to go lower.
VIX: Currently net short 132.2k, up 8k.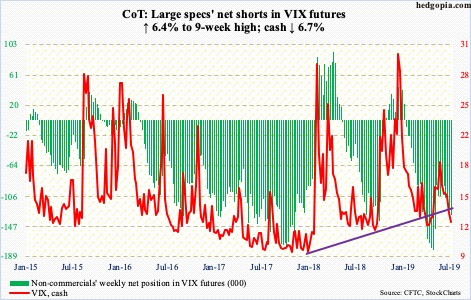
Support at 12 was tested on Friday last week, with an intraday low of 12.28 this week. This level has provided support for nearly four months now. A breach opens the door to a test of 10-11, which acted as a floor for nearly five months before surging late September last year. Before that, the cash (12.39) routinely dropped to eight or nine.
The point is, VIX remains suppressed, but at a higher plateau. This in and of itself is no help to volatility bulls who bet on sustained rally. At the same time, this might just be a window into what might lie ahead medium- to long-term. For now, the weekly may have a little bit more to go on the downside before entering oversold territory.
Thanks for reading!
