
Following futures positions of non-commercials are as of September 3, 2019.
10-year note: Currently net short 377.9k, up 68k.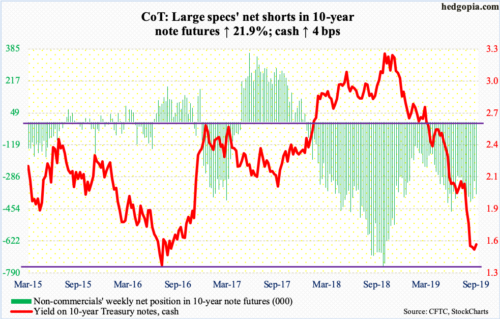
The 10-year Treasury yield (1.55 percent) rallied four basis points this week, but not before setting a three-plus-year low of 1.43 percent on Tuesday. In July 2016, yields fell to 1.34 percent, which was essentially a successful test of 1.39 percent set in July 2012. There is room for more upside in yields, which should bring a much-needed respite for non-commercials who have remained net short 10-year note futures since December 2017.
These traders have been on the receiving end for a while now, most recently since last October when the 10-year peaked at 3.25 percent. Obviously anticipating continued rise in yields, in late September last year, they were net short 756,316 contracts. As rates fell, short squeeze followed. By late January, they had reduced their holdings to 125,752 contracts, before rebuilding. As of Tuesday, they held 377,867 contracts.
On its way down, the 10-year rate broke one after another support. On the way up, there will be overhead supply. Immediately ahead, there is resistance at 1.62 percent; Friday, yields retreated after tagging 1.61 percent intraday. Then comes gap-down resistance at 1.8 percent. The 50-day (1 82 percent) lies around there as well. More importantly, it will be interesting to see how non-commercials behave in the weeks ahead. In the event they get aggressive and add more shorts, this in due course will end up helping bond bulls (price) as shorts – once again – get squeezed.
30-year bond: Currently net short 67.2k, up 16.1k.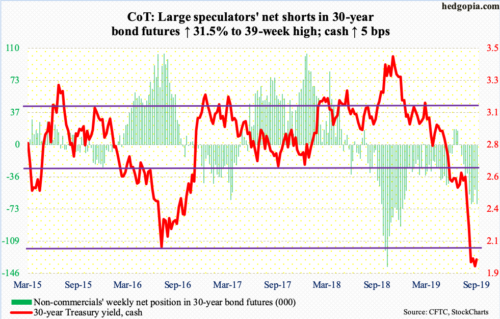
Major economic releases next week are as follows.
On Tuesday, the NFIB optimism index (August) and JOLTS job openings (July) are due out.
Small-business optimism rose 1.4 points month-over-month in July to 104.7. This is the 32nd consecutive month of 100-plus reading, including record 108.8 in August last year.
Non-farm job openings (JOLTS) in June fell 36,000 m/m to 7.35 million. Last November’s 7.63 million is the all-time high.
Wednesday brings the producer price index (August). In July, producer prices rose 0.2 percent m/m, even as core PPI edged down 0.1 percent – first drop since October 2015. In the 12 months to July, both headline PPI and core PPI rose 1.7 percent.
The consumer price index (August) is scheduled for Thursday. July consumer prices – both headline and core – edged up 0.3 percent m/m. In the 12 months to July, they respectively increased 1.8 percent and 2.2 percent.
Retail sales (August) and the University of Michigan’s consumer sentiment index (September, preliminary) will be out Friday.
Retail sales grew 3.5 percent year-over-year in July to a seasonally adjusted annual rate of $523.5 billion – a new high.
Consumer sentiment collapsed 8.6 points m/m in August to 89.8. This was the lowest since October 2016. Back then, sentiment jumped 6.6 points m/m in November to 93.8. That was the month Donald Trump was elected president. Since then, sentiment steadfastly remained in the 90s and 100s. That streak was broken last month, but barely.
WTI crude oil: Currently net long 541k, down 14.1k.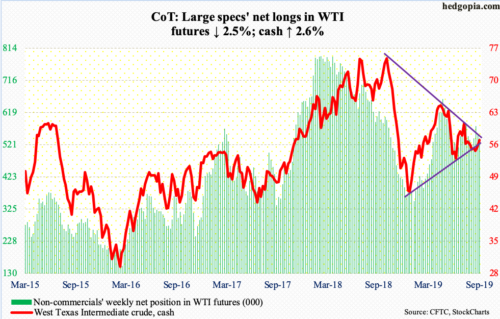
For a while now, the cash ($56.52/barrel) has remained trapped between two trend lines – one falling going back to last October and one rising from last December – and this week did not change that. Thursday, bulls tried to take out that resistance but were denied. Tuesday, however, they defended support at the other trend line. So, the back-and-forth continues. Either way it breaks, momentum likely follows – at least near term.
For the week of August 30, the EIA report showed US stocks fell across the board – crude down 4.8 million barrels to 423 million barrels, gasoline down 2.4 million barrels to 229.6 million barrels and distillates down 2.5 million barrels to 133.5 million barrels. Refinery utilization was down four-tenths of a percentage point to 94.8 percent. Crude production fell 100,000 barrels per day to 12.4 million bpd. Crude imports, however, rose 976,000 bpd to 6.9 mbpd.
E-mini S&P 500: Currently net long 12.3k, down 56.2k.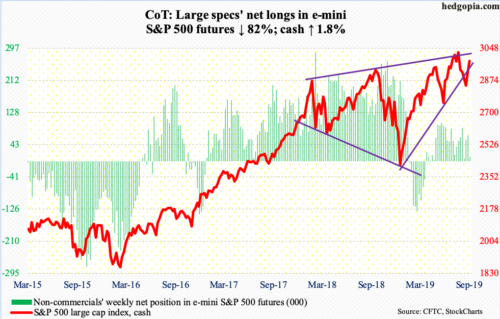
After four weeks of rejection, the cash (2978.71) Thursday took care of resistance at 2940s. The 50-day moving average (2946.48) lies right there. If it is a genuine breakout, it should act as support the next time the index comes under pressure. The daily is beginning to look extended. Both Thursday and Friday, the daily candles had a little bit of a shadow, with a spinning top on Friday.
The breakout took place Thursday. At least until Wednesday, flows were not cooperating. In the week through that session, SPY (SPDR S&P 500 ETF), VOO (Vanguard S&P 500 ETF) and IVV (iShares Core S&P 500 ETF) lost a combined $1.1 billion (courtesy of ETF.com). In the same week, $2.8 billion came out of US-based equity funds (courtesy of Lipper).
Euro: Currently net short 49.2k, up 10.3k.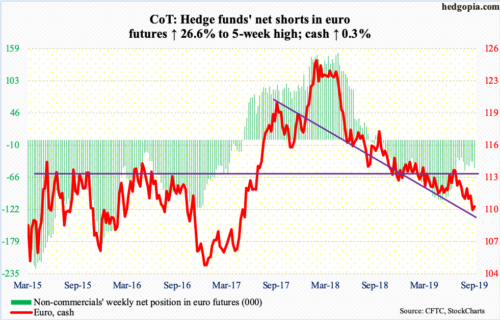
Yet another low in the cash ($110.28) since peaking in January last year at $125.37. Tuesday’s intraday low of $109.29 keeps the pattern of lower highs, lower lows intact. In fact, the euro peaked as far back as April 2008 at $160.20, before making a series of lower highs.
Bulls stepped up Tuesday in defense of horizontal support north of $109. They now have a bigger task at hand, which is to try to take out broken-support-turned-resistance at $111.
Worse, there is decent support at $104-105.
Gold: Currently net long 300.5k, up 3.7k.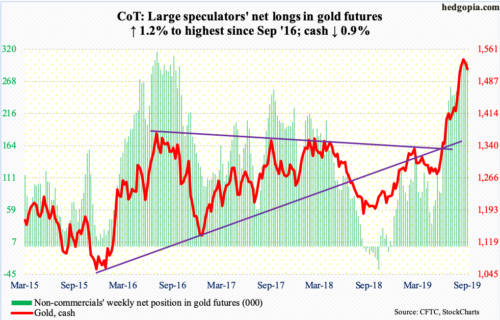
Wednesday’s intraday high of $1,566.20 eclipsed last week’s high of $1,565, but gold bugs continued to struggle to hang on to the gains. The cash ($1,515.50/ounce) traded in the $1,260s as recently as May. It then went parabolic.
It is worth recalling that the metal peaked at record $1,923.70 in September 2011 and began to come under severe pressure after it lost $1,540s-50s.
Amidst this, flows continue to be favorable. In the week ended Wednesday, IAU (iShares Gold Trust) gained $194 million – 11th positive week in 12. GLD (SPDR Gold ETF) took in $663 million – 15th positive week in 16 (courtesy of ETF.com). This data point is now worth a close watch. In the past month, these two ETFs took in $3.6 billion. Gold during that period essentially went sideways. These new longs can lose patience should the metal continue to come under pressure. The daily is grossly overbought. In this scenario, bulls must defend $1,440s-50s. The 50-day lies at $1,468.76.
Nasdaq 100 index (mini): Currently net long 24.5k, up 1.6k.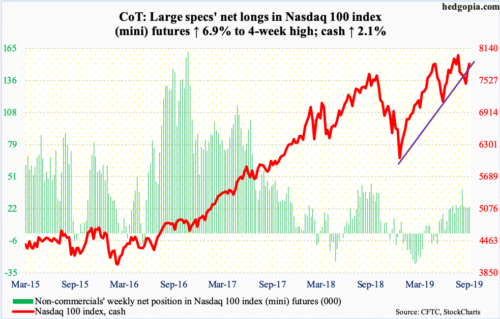
For four consecutive weeks, bulls defended a rising trend line from last December but also got rejected at horizontal resistance at 7700. This ceiling gave way Thursday, which also meant the 50-day (7755.18) was reclaimed.
In the week to Wednesday, QQQ (Invesco QQQ Trust) gained $79 million (courtesy of ETF.com), but this was before the aforementioned breakout. Hopefully for bulls, this will help lure in new funds.
Also, the cash (7852.54) peaked at 8027.18 late July. Before this, it retreated late April after tagging 7851.97. Hence the significance of where the index resides currently. Weakness here can form the right shoulder of a potential head-and-shoulders pattern.
Russell 2000 mini-index: Currently net short 58.9k, down 408.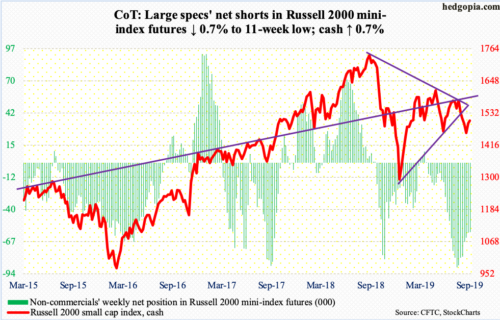
The cash (1505.15) rallied 0.7 percent this week – weaker than several of its major US peers. Several times in the second half last month, support at 1450s, which goes back to July last year, was defended. This preceded sustained pressure lasting weeks, even months, so there is no dearth of resistance. The 200-day (1515.54), for example. Thursday, bulls reclaimed the average intraday, but only to lose it by close. The same thing happened Friday. Right above lies the 50-day (1528.70).
In the best of circumstances for bulls, around 1560 lies dual trend-line resistance – one from August last year when the Russell 2000 peaked at 1742.09 and one from the underside of a broken trend line from last December. This is a pie-in-the-sky scenario for now, and for this to come true, flows for one need to substantially improve.
In the week to Wednesday, $757 million and $233 million came out of IWM (iShares Russell 2000 ETF) and IJR (iShares Core S&P Small-Cap ETF) respectively (courtesy of ETF.com).
US Dollar Index: Currently net long 31.7k, up 1.8k.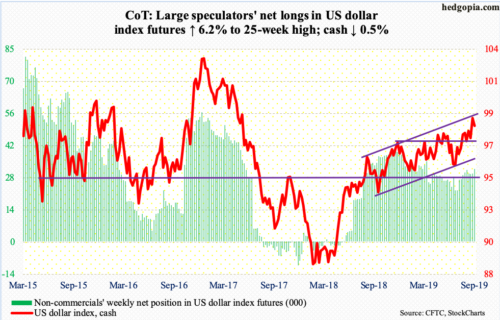
For a year now, the cash (98.36) has played ping pong in a rising channel. In June, it rallied off of the lower bound. Tuesday’s intraday high of 99.33 kissed the upper end, where sellers quickly showed up.
Daily and weekly conditions are in overbought territory. The aforementioned channel support gets tested at 96 (and rising). Before this rests decent support at 97.50s, which approximates the now-rising 50-day (97.46).
VIX: Currently net short 66.6k, up 9.5k.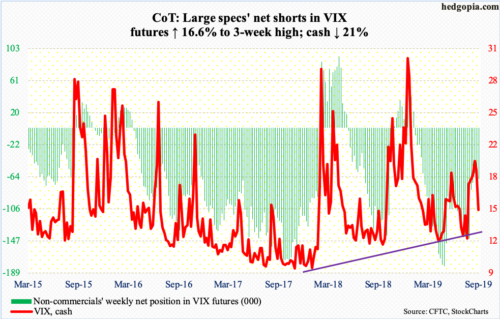
On August 5, the cash (15) peaked at 24.81, followed by a series of lower highs. Prior to that, on July 25, it dropped to 11.69, before successively making higher lows. Having essentially been trapped between these two trend lines for a month, VIX broke to the downside Thursday when it also lost the 200-day (16.96), followed by a loss Friday of the 50-day (16.19). Downside risk remains, particularly if unwinding continues elsewhere in the options market.
The 21-day moving average of the CBOE equity-only put-to-call ratio has come under pressure since peaking at 0.733. It closed out Friday at 0.686. A rising ratio reflects investor fear. If past is prologue, the ratio tends to unwind from high-0.60s to low-0.70s. On Christmas Eve last year, it peaked at 0.744. The S&P 500 made an important low back then. That said, the straight put-to-call ratio printed 0.53 on Thursday and 0.56 on Friday, so optimism is building near term.
Thanks for reading!
