
Following futures positions of non-commercials are as of October 15, 2019.
10-year note: Currently net short 99.7k, down 22.9k.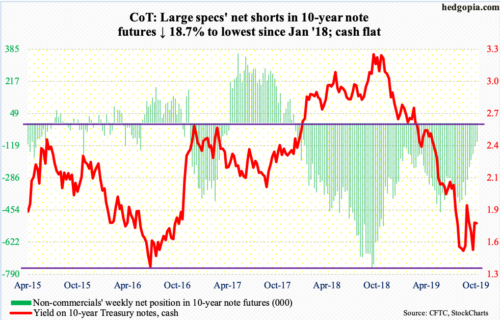
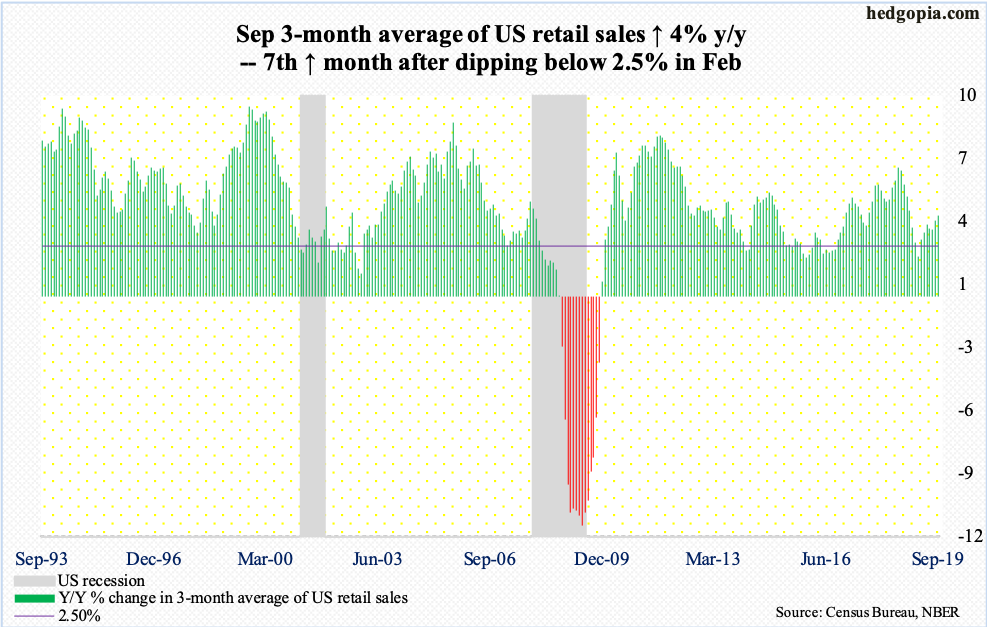
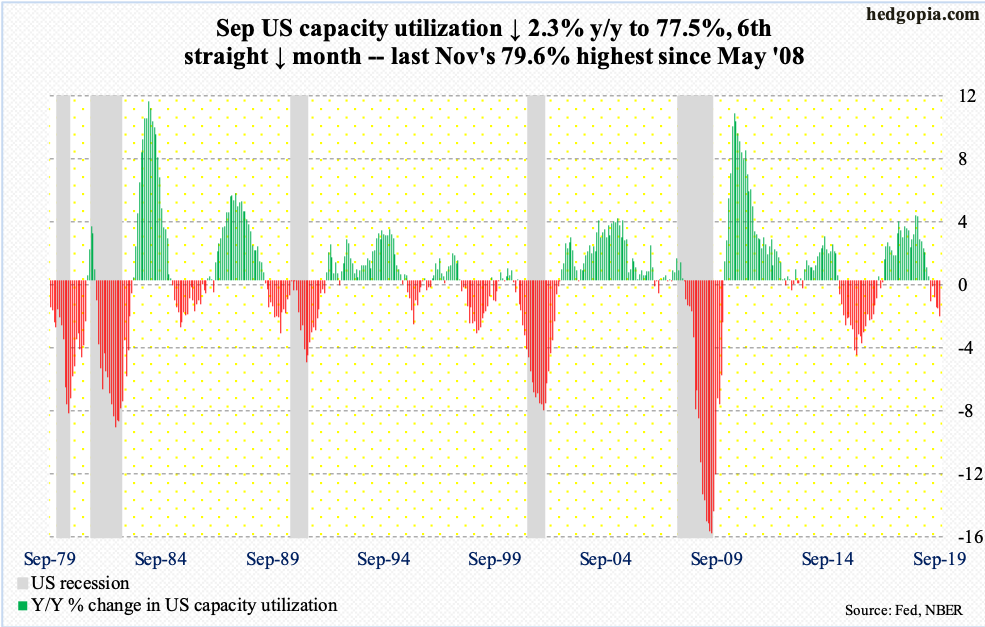
Most US economic data out this week continued to point to sluggish activity. Retail sales in September fell 0.25 percent month-over-month to a seasonally adjusted annual rate of $525.6 billion; this was the first down month in seven. September capacity utilization dropped 2.3 percent year-over-year to 77.5 percent – sixth straight down month – with the cycle high 79.6 percent last November. Last but not the least, housing starts dropped 9.4 percent m/m in September to 1.26 million units (SAAR), although August’s 1.39 million was the cycle high.
The 10-year Treasury yield (1.75 percent) held its own this week. Last week, it reclaimed the 50-day moving average (1.64 percent), and has pretty much gone sideways since. Hopefully for bond bears (price), this eventually leads to another leg higher. Nearest resistance lies at 1.90-1.95 percent. Reclaiming the September 13th high of 1.90 percent will set a higher high. Rates already formed a higher low on the 8th this month – 1.51 percent versus 1.43 percent from September 3.
Near term, though, the daily is in overbought territory and could come under downward pressure. Besides the 50-day, trend-line support from the aforementioned September low lies at 1.53 percent.
30-year bond: Currently net short 55k, down 21.7k.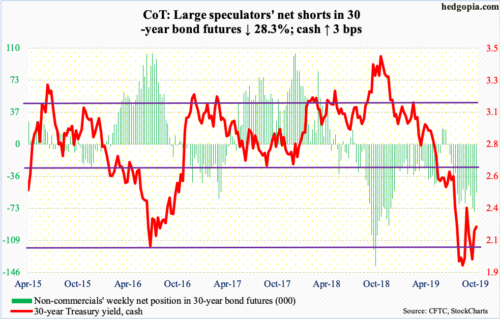
Major economic releases next week are as follows.
Existing home sales (September) will be out Tuesday. Sales in August rose 1.3 percent m/m to a seasonally adjusted annual rate of 5.49 million units. The cycle high 5.72 million units was reached in November 2017.
Durable goods orders (September) and new home sales (September) are scheduled for Thursday.
In the 12 months to August, orders for non-defense capital goods ex-aircraft – proxy for business capex plans – dropped 0.4 percent to $69.2 billion (SAAR). This was the second consecutive year-over-year drop after 31 positive months in a row.
August sales of new homes jumped 7.1 percent m/m to 713,000 units (SAAR) – not too far away from the cycle high 729,000 units reached in June.
Friday brings the University of Michigan’s consumer sentiment index (October, final). Preliminarily, consumer sentiment increased 2.8 points m/m in October to 96. Except for August’s 89.8, sentiment has been north of 90 since November 2016, four of them over 100.
WTI crude oil: Currently net long 510.4k, down 12.4k.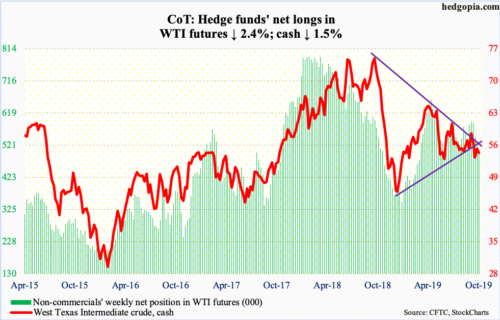
After successfully testing $50-51 support last week, the cash ($53.87/barrel) continued to consolidate this week. The 10-day has curled up, and bids are showing up around that average. The 50- and 200-day are right above ($55.39 and $56.95 respectively). Around $56 also lies trend-line resistance from last October’s high.
In the meantime, US crude production in the week to October 11 remained unchanged at 12.6 million barrels per day – a record. The EIA report also showed that refinery utilization dropped 2.6 percentage points to 83.1 percent, thanks primarily to maintenance. Crude imports rose 71,000 bpd to 6.3 mbpd. And crude stocks jumped 9.3 million barrels to 434.9 million barrels. Stocks of gasoline and distillates, however, declined 2.6 million barrels and 3.8 million barrels respectively to 226.2 million barrels and 123.5 million barrels.
E-mini S&P 500: Currently net long 20.7k, down 33.4k.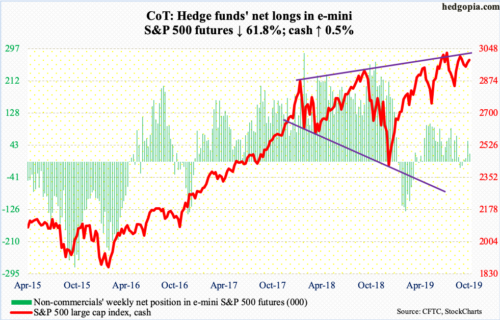
This is how the week’s sessions progressed – a doji, a white marubozu with a little bit of a wick, a doji, a spinning top and finally a red candle on Friday. Despite this rather lethargic action, the cash (2986.20) rallied 0.5 percent this week. There is trend-line resistance at 3015 – prior highs of 3027.98 on July 26 and 3021.99 on September 19. Thursday, the S&P 500 retreated after tagging 3008.29. A breakout, followed by a new high, is within reach, but may have to wait. The daily is in need of unwinding its overbought condition.
Flows cooperated this week, but bulls will need a lot more should they are to build on recent momentum. In the week to Wednesday, US-based equity funds gained $3.1 billion (courtesy of Lipper). This followed outflows of $27.4 billion in the prior three. In the same week, SPY (SPDR S&P 500 ETF), VOO (Vanguard S&P 500 ETF) and IVV (iShares Core S&P 500 ETF) took in a combined $3.5 billion (courtesy of ETF.com).
For whatever it is worth, foreigners were not much willing to take advantage of August’s selloff in US stocks (more here).
Euro: Currently net short 75.2k, down 259.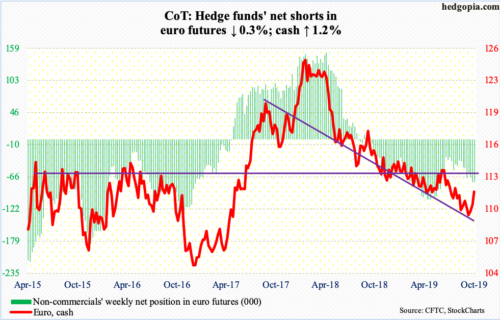
The cash ($111.72) sprung to life this week. The 50-day ($110.42) was recaptured. As was horizontal resistance just north of $111. Shorter-term moving averages are pointing up. The euro rallied 1.1 percent for the week – its third straight positive week. The daily is beginning to get extended. The 200-day rests at $112.19.
Gold: Currently net long 253k, down 22.5k.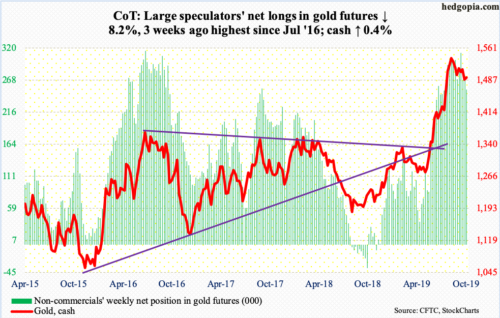
The cash ($1,494.10/ounce) peaked on September 4 at $1,566.20. All the way going back to September 2011, gold peaked at record $1,923.70 and began to unravel after it lost $1,540s-50s. Plus, a 61.8-percent Fibonacci retracement of the September 2011-December 2015 decline lies at $1,588. Hence the significance of where gold peaked last month. Since then, the metal has formed lower highs.
That said, from gold bugs’ perspective, the good thing is that support at $1,440s-50s is holding. In fact, October opened with a breakout retest. As long as this level does not give way, they deserve the benefit of the doubt and would have bettered their odds should $1,515 is recaptured. The 50-day ($1,514.72) lies there, so does a falling trend line from last month’s high.
For that to happen, flows need to improve. In the week to Wednesday, $254 million came out of GLD (SPDR Gold ETF), while IAU (iShares Gold Trust) drew $75 million (courtesy of ETF.com).
Nasdaq 100 index (mini): Currently net long 32.4k, up 14.3k.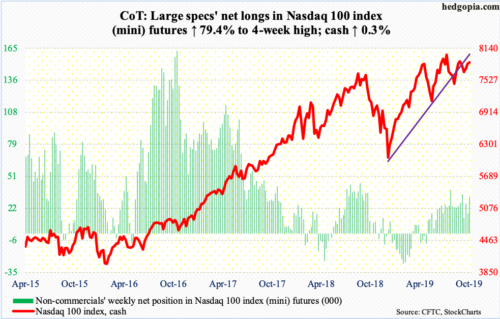
Amidst subtle signs of fatigue, the cash (7868.49) Tuesday broke out of a falling trend line from July 26 when it peaked at an all-time high of 8027.18. Intraday Thursday, the Nasdaq 100 was merely 0.6 percent from that high. Friday, however, the Nasdaq 100 fell 0.9 percent to once again drop back under that trend line. A genuine breakout can lead to short squeeze. Nasdaq short interest is at a four-year high (more here). Flows can play a major role in this regard. In the week to Wednesday, QQQ (Invesco QQQ Trust) took in $1.2 billion (courtesy of ETF.com).
Next week’s trading should be interesting, as major tech outfits such as Microsoft (MSFT) and Intel (INTC) report. A rising trend line from last December gets tested at 7800, with the 50-day at 7739.08.
Russell 2000 mini-index: Currently net short 34.3k, down 7.1k.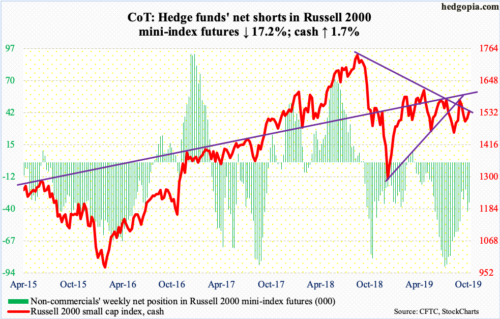
In the week to Wednesday, IWM (iShares Russell 2000 ETF) and IJR (iShares Core S&P Small-Cap ETF) respectively gained $1.1 billion and $180 million (courtesy of ETF.com). This followed two successive weeks of outflows losing $2.5 billion and $368 million, in that order. Last week, the cash (1536.86) had a positive week after three straight negative weeks. This week, it rallied another 1.7 percent.
Thursday, bulls were able to reclaim the 200-day (1531.62), which was preceded by Tuesday’s recapturing of the 50-day (1514). Before they can go after major resistance just north of 1600, they face a roadblock at 1560, which represents trend-line resistance from August last year. The Russell 2000 peaked at 1742.09 back then.
Immediately ahead, bulls face the challenge of saving the 200-day, which was already tested Friday.
US Dollar Index: Currently net long 37.4k, down 2.4k.
The rejection seven weeks ago at the upper bound of a 14-month rising channel is proving costly. The cash (97.01) is now down for three straight weeks. This week, bulls tried to reclaim the 50-day (98.19) but to no avail. They also failed to hold horizontal support at 97.50s. The 200-day (97.06) is slightly breached. The lower bound of the channel in question lies at 96. There is room for the weekly to continue lower.
VIX: Currently net short 156k, up 17.3k.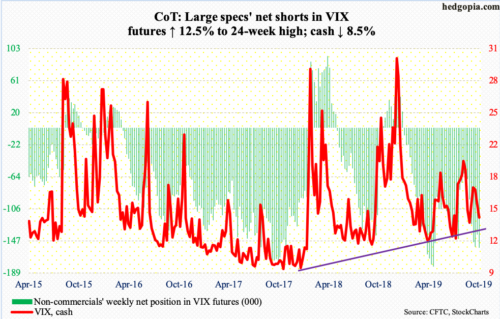
Thursday’s intraday low on the cash (14.25) of 13.31 matched the low from September 19, before ending the session with a long-legged doji. Friday produced another session with long shadows. The daily lower Bollinger band lies at 12.45, which likely is the risk near term for volatility bulls. Otherwise, the daily is itching to rally. On the 2nd this month, VIX tagged 21.46 intraday.
In the meantime, non-commercials’ net shorts stood at a 24-week high. In the week ended April 30 this year, they held record 180,359 net shorts. Historically, the cash does not peak until these traders get net long, or substantially curtail their bearish bets.
Thanks for reading!
