
Following futures positions of non-commercials are as of October 22, 2019.
10-year note: Currently net short 84.4k, down 15.3k.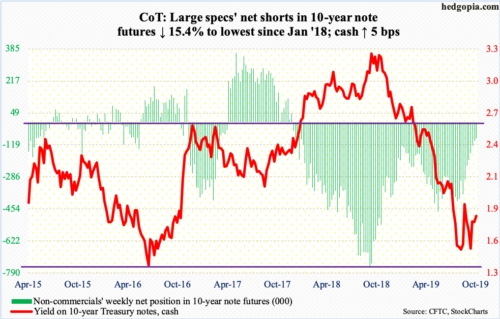
Next week, the FOMC meets. Wednesday, the Fed is expected to ease. Futures traders are betting with a 93.5-percent probability that a 25-basis-point cut is coming. This would be the third cut in the fed funds rate this year, to a range of 150 to 175 basis points.
The US economy is in deceleration but holding up. Real GDP is expected to have grown at a 1.8 percent rate in the third quarter. With post-Great Recession recovery/expansion in its 11th year, it is normal to show signs of wear and tear.
The bigger question is, with the policy rates as low as they already are, how would the Fed deal with the next downturn, which is not a matter of if, but when? During the financial crisis, after essentially pushing rates to the zero bound, the bank resorted to three iterations of quantitative easing. As things stand, the Fed likely goes down that path again when the economy contracts.
Post-financial crisis, major central banks increasingly act as if they have the power – and the tools – to stop recession from occurring. Business cycles are a natural part of economy and are needed to get rid of the excesses that accumulate during good times. Turning a blind eye to this fact only helps exacerbate the underlying problem.
30-year bond: Currently net short 46.3k, down 10.3k.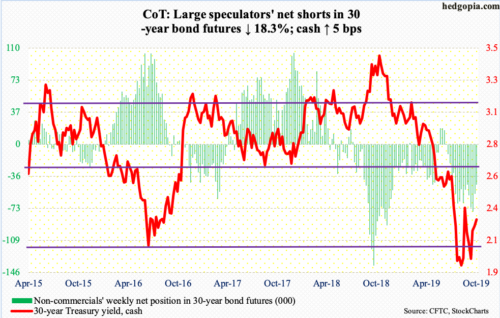
Major economic releases next week are as follows.
The S&P Case-Shiller home price index (August) is published Tuesday. Nationally, home prices rose 3.2 percent in the 12 months to July. This was the 16th consecutive price deceleration since appreciating 6.5 percent in March last year.
GDP (3Q19, preliminary) comes out Wednesday. Real GDP expanded two percent in 2Q, down from 3.1 percent in 1Q.
Thursday brings the employment cost index (3Q19) and personal income (September).
In the 12 months ended 2Q19, total compensation costs for private industry workers increased 2.6 percent, which was the slowest pace in six quarters.
Core PCE – the Fed’s favorite measure of consumer inflation – rose 1.8 percent year-over-year in August. The Fed has a two percent goal.
Friday, employment (October) and the ISM manufacturing index (October) are due out.
In September, the economy added 136,000 non-farm jobs, for a monthly average this year of 161,000, which is substantially below last year’s monthly average of 223,000.
Manufacturing activity in September contracted 1.3 points month-over-month to 47.8. This was the second straight month of sub-50 reading.
WTI crude oil: Currently net long 512.5k, up 2.1k.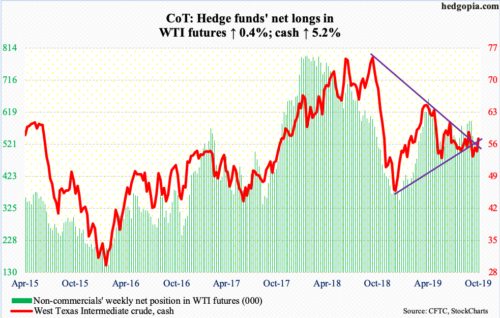
Bulls stepped up this week near moving averages – shorter-term early in the week and the 50-day on Thursday and Friday. The cash ($56.66/barrel) also poked its head out of trend-line resistance from October last year when it peaked at $76.90. The 200-day lies above at $57.08. This approximates horizontal resistance just north of $57. Immediately ahead, sellers might show up there.
In the week to October 18, US crude production remained unchanged at 12.6 million barrels per day – a record – but stocks fell across the board. The EIA report showed inventories of crude, gasoline and distillates dropped 1.7 million barrels, 3.1 million barrels and 2.7 million barrels to 433.2 million barrels, 223.1 million barrels and 120.8 million barrels, in that order. Refinery utilization improved 2.1 percentage points to 85.2 percent. Crude imports decreased 438,000 bpd to 5.9 mbpd – the lowest since February 1996.
E-mini S&P 500: Currently net long 23.3k, up 3.4k.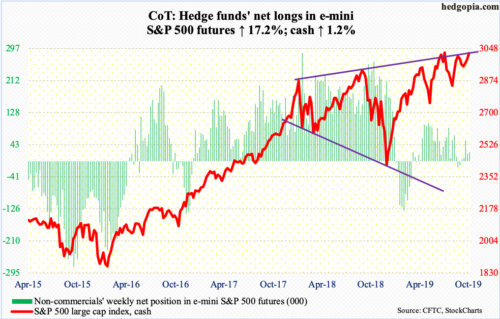
The cash (3022.55) rallied 1.2 percent this week to break through trend-line resistance from July 26 when it peaked at 3027.98. In fact, intraday Friday the S&P 500 was less than a point from posting a new high. At the same time, the index has rallied nicely since bottoming at 2855.94 on the 3rd early this month. The daily is way extended, with the weekly beginning to get overbought as well.
Flows continue to be tentative. In the week to Wednesday, US-based equity funds lost $3.9 billion, reversing prior week’s $3.1 billion in inflows (courtesy of Lipper). In the same week, SPY (SPDR S&P 500 ETF), VOO (Vanguard S&P 500 ETF) and IVV (iShares Core S&P 500 ETF) lost a combined $1.1 billion (courtesy of ETF.com).
Euro: Currently net short 51.1k, down 25.8k.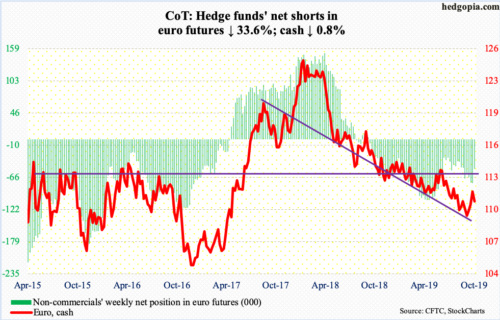
In Mario Draghi’s last meeting as ECB president, rates were left unchanged, with the deposit rate at minus 50 basis points. The cash ($110.80), already under pressure this week, bade adieu to Draghi with a yawn, down 0.2 percent on Thursday. For the week, it was down 0.8 percent.
Monday, the euro tagged $111.74, before retreating. On the 1st this month, it touched $108.85. The daily was extended, and this is being unwound currently. Support at the 50-day lies at $110.38.
Gold: Currently net long 259.1k, up 6.1k.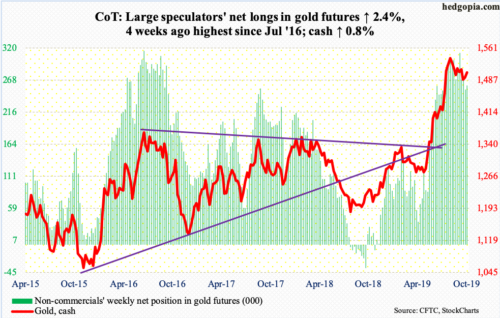
Gold bugs continued to defend one-month, slightly-rising trend line, with Tuesday’s intraday low of $1,484 kissing that support. This followed a peak in the cash ($1,505.30/ounce) on September 4 at $1,566.20. All the way going back to September 2011, gold peaked at record $1,923.70 and began to unravel after it lost $1,540s-50s. Plus, a 61.8-percent Fibonacci retracement of the September 2011-December 2015 decline lies at $1,588.
The metal came under pressure after last month’s high, but never lost support at $1,440s-50s. On October 1, it bottomed at $1,465. Friday, it sought to take out both the September trend line and the 50-day, but to no avail, ending the session right on the trend line. A breakout opens the door to a test – again – of $1,540s-50s.
In the week to Wednesday, GLD (SPDR Gold ETF) and IAU (iShares Gold Trust) respectively gained $15 million and $136 million (courtesy of ETF.com).
Nasdaq 100 index (mini): Currently net long 31.1k, down 1.3k.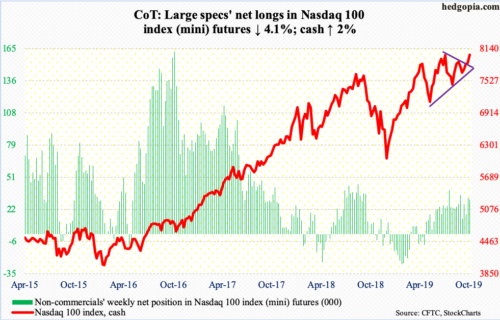
Amidst a mixed batch of earnings, with Microsoft (MSFT), Intel (INTC) and Tesla (TSLA) delivering and Texas Instruments (TXN), IBM (IBM) and Amazon (AMZN) disappointing, the cash (8029.22) rallied two percent this week, to a new intraday high of 8033.29. At this point in time, it now becomes a question of what next.
Most of the earnings-related push is behind us. The Nasdaq 100 has rallied for four straight weeks. Next week, Alphabet (GOOG) reports Monday and Apple (AAPL) Wednesday. AAPL is at a new high, and GOOG is itching to break out. We will see what next week brings. Tech has had a lot of momentum, but it is also hard to sustain this pace. The daily is grossly overbought and is in need of unwinding.
In the week to Wednesday, QQQ (Invesco QQQ Trust) lost $680 million (courtesy of ETF.com).
Russell 2000 mini-index: Currently net short 27.1k, down 7.2k.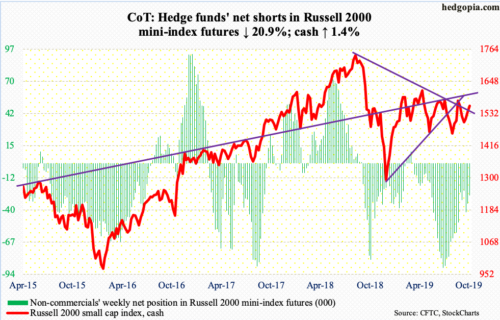
Small-cap bulls last week reclaimed the 200-day, and built on it further this week, rallying 1.4 percent. That said, the cash (1558.71) tried to go after trend-line resistance from August last year several times but came up slightly short. A rally past 1565 likely opens the door to a test of 1600, where bulls have been rejected several times. The daily remains in overbought territory.
In the week to Wednesday, IWM (iShares Russell 2000 ETF) and IJR (iShares Core S&P Small-Cap ETF) respectively lost $54 million and $267 million (courtesy of ETF.com).
US Dollar Index: Currently net long 31.2k, down 6.2k.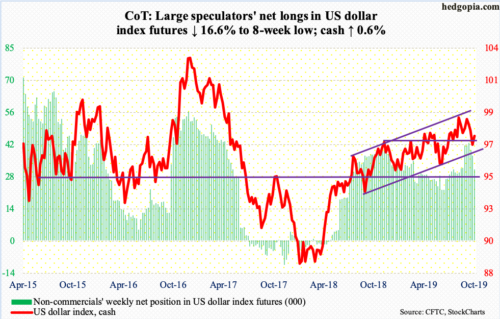
In three weeks, the cash (97.60) dropped intraday from 99.31 on the 1st this month to Monday’s 96.89, when the 200-day (97.11) was slightly breached. No sooner was the average lost than it was recaptured. There is room for the daily to continue higher. Once horizontal resistance at 97.50s genuinely gives way, the 50-day gets tested at 98.16.
VIX: Currently net short 171.2k, up 15.3k.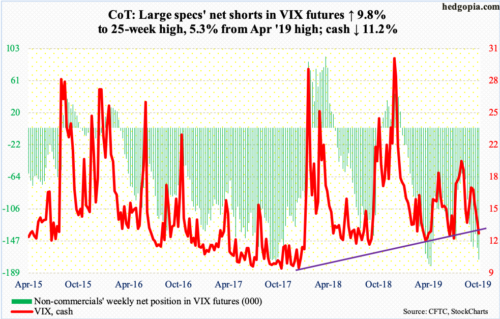
On an intraday basis, a rising trend line from April this year extends to 12, which, if tested, will have tested July lows as well as the daily lower Bollinger band. Risk of this happening has risen after 13.50s gave way Friday. The 10-day is still pointed lower, and this is where the cash (12.65) faced resistance this week.
In the meantime, the S&P 500 has rallied for three straight weeks. Amidst this, in the nine sessions through Thursday (Friday was 0.56), the CBOE equity-only put-to-call ratio printed 0.60s or higher. Stocks are rallying, but at the same time protection is being sought. This has pushed up the 21-day moving average of the ratio, which ended the week at 0.688. On the 18th, it stood at 0.699. Historically, the ratio tends to unwind from high 0.60s to low 0.70s. Should stocks come under pressure near term, the ratio likely continues higher. On August 23, it rose to 0.733 and to 0.744 on December 24, before unwinding, which laid the foundation for the rallies that followed.
Thanks for reading!
