
Following futures positions of non-commercials are as of May 5, 2020.
10-year note: Currently net short 142.3k, up 92.8k.
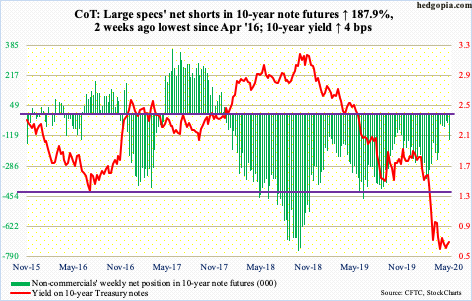
On March 9th intraday, the 10-year Treasury yield made an all-time low of 0.4 percent. On February 6th, yields tagged 1.67 percent before dropping like a rock. Since that record low, two different investment vehicles went in the opposite direction.
In the week to March 10th, non-commercials held 214,583 net shorts in 10-year note futures, which rose further to 251,113 contracts in the following week, before dropping to 34,098 by the week to April 21st. These traders were positioned for a rise in yields, which did not materialize. On the other hand, between March 9th and Wednesday this week, according to ETF.com, $3.5 billion left TLT (iShares 20+ year Treasury bond ETF). If these investors expected the 10-year rate to fall, they would have added, not cut back.
Amidst this push and pull, the 10-year (0.68 percent) continues to trade in a sideways pattern. Tuesday’s intraday high of 0.74 percent tagged the daily upper Bollinger band, which finds itself just under the 50-day moving average at 0.76 percent.
There is crucial support at 0.58 percent, which makes up the lower trend line of a descending triangle. More often than not, this tends to be a continuation pattern. Yields have been in a downtrend for over three decades, and most recently since October 2018 when the 10-year yielded 3.25 percent. Be that as it may, right here and now, it is trying to go the other way. There is a potentially bullish 10/20 crossover in the making, even as daily Bollinger bands are narrowing.
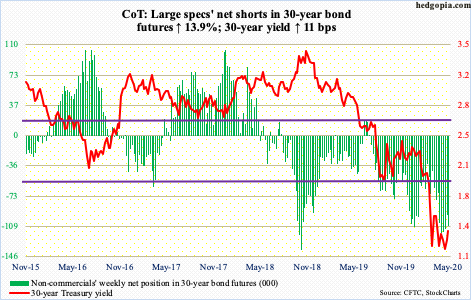
30-year bond: Currently net short 108.8k, up 13.3k.
Major economic releases next week are as follows.
Tuesday, the NFIB optimism index (April) and the consumer price index (April) are scheduled.
Small-business optimism fell 8.1 points month-over-month in March to 96.4. This was the lowest print since October 2016 and the first sub-100 reading since December that year.
Over February, headline and core consumer prices in March dropped 0.4 percent and 0.1 percent, in that order. In the 12 months to March, they respectively rose 1.5 percent and 2.1 percent.
The producer price index (April) is due out Wednesday. March producer prices rose 0.3 percent m/m and at three percent year-over-year. At the core level, they respectively advanced 0.4 percent and 2.9 percent.
Friday brings retail sales (April), industrial production (April), JOLTS job openings (March), the University of Michigan’s consumer sentiment index (May) and Treasury International Capital data (March).
In the 12 months to March, retail sales tumbled 6.2 percent to a seasonally adjusted annual rate of $483.1 billion. This was the first y/y contraction since October 2009.
Capacity utilization dropped 7.2 percent y/y to 72.7 percent in March – a 10-year low.
In February, job openings shrunk by 130,000 m/m to 6.88 million. The all-time high of 7.52 million was reached in January 2019.
Consumer sentiment collapsed 17.3 points m/m to 71.8 in April. This was the lowest reading since December 2011.
In February, foreigners purchased $11.5 billion in US stocks, for a 12-month total of $53.1 billion. As recently as April last year, they were selling $214.6 billion worth – a record.
WTI crude oil: Currently net long 684.5k, down 65k.
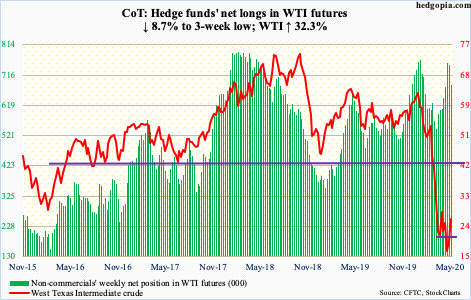
Tuesday, WTI ($26.17/barrel) gapped up to take out resistance at $19-20 and then immediately go test another roadblock at $27-28. The crude kept hammering on this ceiling the next three sessions, but no breakout just yet. A breakout opens the door toward gap-down resistance at $35.
The daily is beginning to get extended. On April 21st, oil tagged $6.50. As things stand, breakout retest at $19-20 is more likely than a march toward $35. In this scenario, shorter-term moving averages are curling up to line up at $19-20, which will be an opportunity for bulls to step up and defend the breakout.
On the inventories front, US crude stocks continued to build. The EIA report for the week of May 1 showed they rose by 4.6 million barrels to 532.2 million barrels – the highest since April 2017. Distillate stocks increased as well, up 9.5 million barrels to 151.5 million barrels, which is the highest since July 2017. Crude imports grew by 410,000 barrels/day to 5.7 million b/d. Crude production continued to drop, down 200,000 b/d to 11.9 mb/d, as producers get rid of their uneconomic production. Production peaked in February and March at 13.1 mb/d. Gasoline stocks dropped as well, down 3.2 million barrels to 256.4 million barrels. Refinery utilization inched up 0.9 percentage points to 70.5 percent.
E-mini S&P 500: Currently net short 222.4k, down 43.2k.
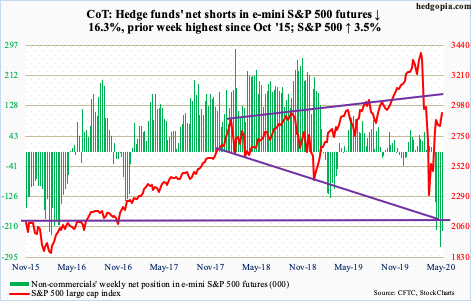
Bears were unable to build on last week’s weekly shooting star. The S&P 500 large cap index (2929.80) jumped 3.5 percent this week. Despite this, it remains below the April 29th intraday high of 2954.86. There were two shooting stars in the first four sessions this week.
Off the March low through the aforementioned high, the S&P 500 rallied nearly 35 percent. That is a lot of gains in such a short period of time. Some are cashing in.
In the week to Wednesday, on the heels of outflows of $7 billion in the prior week, $15.6 billion came out of US-based equity funds (courtesy of Lipper). In the same week, SPY (SPDR S&P 500 ETF), VOO (Vanguard S&P 500 ETF) and IVV (iShares Core S&P 500 ETF) collectively lost $5.4 billion, for a four-week withdrawal of $19 billion (courtesy of ETF.com).
In the meantime, money-market assets were up $34.3 billion in the week to Wednesday to $4.77 trillion – yet another record. Cash continues to accumulate even as AAII bears at 52.7 percent this week were the highest since April 2013. In the past, these levels of bearishness marked major bottoms in stocks. Six weeks ago, when stocks were bottoming, AAII bears were 52.1 percent (chart here). Even after the massive rally off of that low, they are still stuck there, which is a very strange behavior on their part.
Euro: Currently net long 76.3k, down 3.4k.
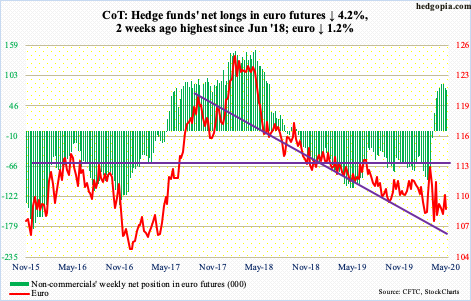
Tuesday, Germany’s top court gave the ECB three months to fix its asset purchase program, which has been a concern for them since at least 2015, when the case was filed. Then, in 2017, the European Court of Justice rejected the line of interpretation of the law suggested by their German counterparts. The German court is essentially saying the Bundesbank/ECB is acting outside the law and that the German central bank must stop buying government bonds. Markets do not think this is going to happen.
The euro ($108.75), which began the week with a down Monday came under more pressure on Tuesday. Last Friday, it peaked at $110.18 – just under the 200-day. By this Thursday, the currency was testing support at $107.60s, and that was bought. This support goes back nearly three months. Both the 10- and 20-day, which are flattish to slightly rising, have converged around $108.60s-70s, which needs to fall for upward momentum.
Gold: Currently net long 250k, down 12.7k.
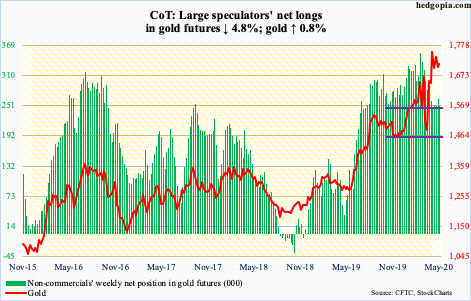
Yet again, gold ($1,713.90/ounce) was pushed under $1,700 on Tuesday through Thursday, but only to see gold bugs step up and buy the weakness. The metal continues to hover above $1,700. This has been going on for five weeks now, will full cooperation from flows.
In the week to Wednesday, IAU (iShares Gold Trust) and GLD (SPDR Gold ETF) respectively gained $221 million and $1.1 billion, for a cumulative seven-week total of $10.4 billion (courtesy of ETF.com).
This week, the yellow metal rallied 0.8 percent. This came despite the fact that gold refineries are resuming operations. Earlier, gold supply was disrupted by coronavirus-spurred closures.
Nasdaq 100 index (mini): Currently net long 12.8k, up 1.8k.
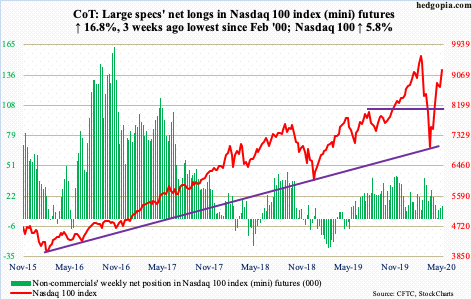
As crazy as this may sound, the Nasdaq 100 is now up 5.6 percent for the year! Some may find tech bulls delusional, some others visionary as they are looking out toward a future where a cure for Covid-19 is found and the economy snaps back with vigor.
Time will tell if the optimists or pessimists come out on top. We know this much. Sentiment, once again, is effusive. Friday, 95 percent of Nasdaq 100 stocks were above their respective 50-day (more on this here). In contrast, 76.9 percent of Nasdaq stocks were above the 50-day. Money continues to flow to larger-cap stocks. Things are very top-heavy.
The reality is that the economic damage wrought by the virus will not be fixed overnight. In all probability, those expecting a quick turnaround will be disappointed. Stocks, however, increasingly are pricing in a sustained V-shaped recovery, not a U, or a W, or an L.
In the week to Wednesday, another $366 million moved into QQQ (Invesco QQQ Trust), for a three-week total of $3.2 billion (courtesy of ETF.com).
This week, the Nasdaq 100 (9220.35) broke out of 9100, right into gap-down resistance at 9200.
Russell 2000 mini-index: Currently net short 22.5k, down 13k.
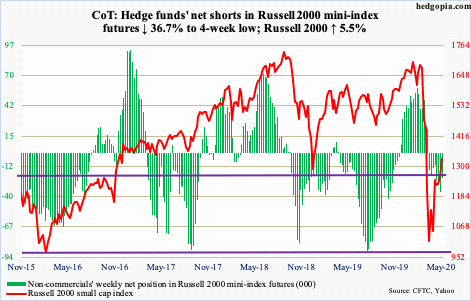
Small-cap bulls were this close to losing crucial dual support on Monday. At session lows, the Russell 2000 small cap index (1329.64) was down to 1234.01 before bids showed up to end the session up 0.3 percent to 1263.97; at session lows, the index lost both five-year horizontal support at 1250s and a rising trend line from the March low. By Friday, it was comfortably above both these levels.
Immediately ahead, should upward momentum continue, the April 29th high of 1373.39 is the new reference point.
US Dollar Index: Currently net long 16.4k, up 337.
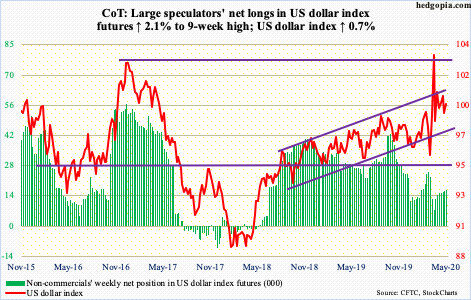
Dollar bulls slightly built on last Friday’s defense of short-term support at 98.80s. By Thursday this week, the US dollar index (99.77) once again tested five-year horizontal resistance at 100.50-101 but was rejected. This level has been a roadblock for a month now. Just north of 101 also lies the upper bound of an ascending channel going back to August 2018. The 50-day (99.48) was tested Friday and likely gets tested again.
VIX: Currently net short 28.4k, up 9.4k.
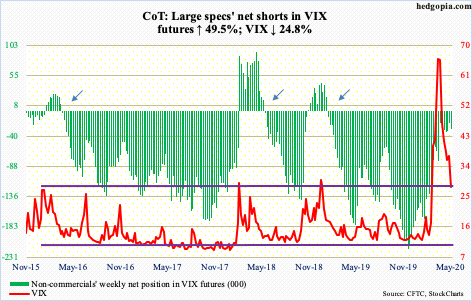
Monday’s rally attempt tagging 40.32 intraday was strongly denied at the 20-day. In the next couple of sessions, the 10-day came in the way. Both averages are still dropping. They were looking to flatten out last week, but this week’s action has changed that. By Thursday, VIX (27.98) was clinging on to support just north of 30. This gave way Friday, closing out the week into support zone at mid- to high-20s. The 200-day lies at 23.49.
Thanks for reading!
