
Following futures positions of non-commercials are as of May 26, 2020.
10-year note: Currently net short 38.1k, down 55.1k.
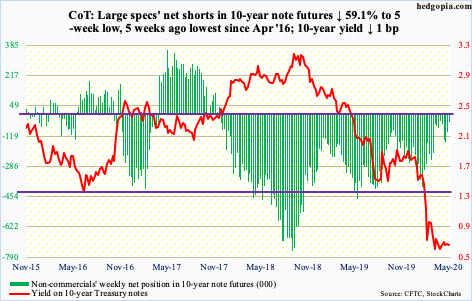
The 10-year treasury yield (0.65 percent) has essentially gone sideways for nearly three months now. This was at a time when the Fed’s holdings of notes and bonds went up by $1.4 trillion to $3.5 trillion. This buying was kind of offset by selling by foreigners, who on a net basis in March sold $299.3 billion in notes and bonds, for a 12-month total of minus $388.9 billion.
The Fed continues to purchase these securities, but at an increasingly reduced pace. This week, the week-over-week change in the four-week average came in at $30.6 billion, down from $262.9 billion mid-April. At some point, this should matter.
This is happening at a time when the daily Bollinger bands on the 10-year rate have narrowed to a point a sharp move is imminent – either up or down. On the weekly, a potentially bullish MACD crossover is likely at work. For a breakout to occur in yields, bond bears need to first reclaim 0.74 percent. With all that said, non-commercials have continued to cut back their net shorts. They are not betting on a breakout in yields.
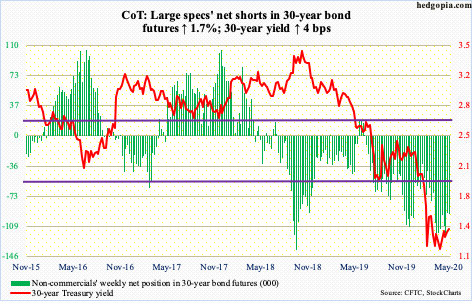
30-year bond: Currently net short 94.5k, up 1.6k.
Major economic releases next week are as follows.
The ISM manufacturing index (May) is scheduled for Monday. Manufacturing activity in April dropped 7.6 points month-over-month to 41.5, which is the lowest since 39.9 in April 2009. During Great Recession, December 2008 recorded the lowest reading of 34.5.
Wednesday brings the ISM non-manufacturing index (May) and durable goods orders (April, revised).
Services activity collapsed 10.7 points m/m in April to 41.8. This is the lowest since 40.1 in March 2009. Great Recession ended in June that year.
Preliminarily, in the 12 months to April, orders for non-defense capital goods ex-aircraft – proxy for business capex plans – declined 6.3 percent to a seasonally adjusted annual rate of $61.9 billion. This follows a 2.4 percent drop in March.
Labor productivity (1Q20, revised) is due out Thursday. Preliminarily, non-farm output per hour edged up 0.25 percent in 1Q20 over 1Q19. Sequentially, it dropped 2.5 percent.
Nonfarm payrolls (May) are on tap Friday. In April, non-farm jobs collapsed 20.5 million m/m to 131.1 million. This just about wiped out the 21.4 million jobs created post-Great Recession.
WTI crude oil: Currently net long 699.3k, down 2.3k.
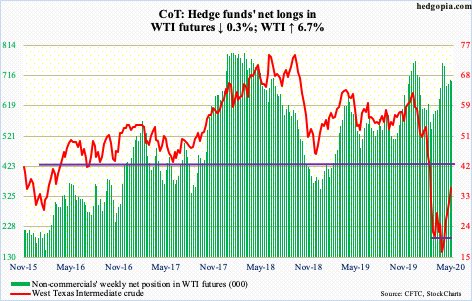
In the last several sessions, oil bulls showed up near the 10-day on WTI. Both Thursday and Friday, intraday weakness was bought just under that average. At the same time, just under $35 lies gap-down resistance from early March. WTI closed out the week at $35.49/barrel. The crude has stalled out at this level the last several sessions. In the best-case scenario, the gap gets filled just north of $41.
In the meantime, the EIA report for the week of May 22 showed that US crude production continued lower, down another 100,000 barrels per day to 11.4 million b/d. Production peaked in February/March at 13.1 mb/d. Gasoline stocks dropped as well, down 724,000 barrels to 255 million barrels. Refinery utilization rose 1.9 percentage points to 71.3 percent. Stocks of crude and distillates, however, rose – up 7.9 million barrels and 5.5 million barrels to 534.4 million barrels and 164.3 million barrels, respectively. Crude imports grew by two mb/d to 7.2 mb/d.
E-mini S&P 500: Currently net short 276.7k, up 23.8k.
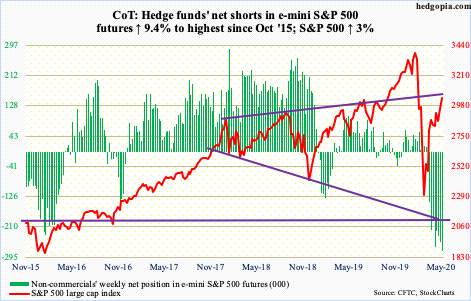
US-based equity funds continued to bleed. In the week to Wednesday, $2.9 billion was withdrawn (courtesy of Lipper). This was the fifth straight week of outflows, for total redemptions of $32.9 billion. In the same week, SPY (SPDR S&P 500 ETF), VOO (Vanguard S&P 500 ETF) and IVV (iShares Core S&P 500 ETF) collectively took in $508 million, which is better than prior week’s loss of $4.6 billion but nothing major (courtesy of ETF.com).
Nevertheless, the S&P 500 (3044.31) began the trading week with a range breakout Tuesday. It was a month-and-a-half 200-point range. In ideal circumstances, bulls could be eyeing 3150. This week, the index rallied three percent and the 200-day (3001.90) was recaptured. Friday, weakness was bought near that average for a 1.5 percent intraday move.
The index remains comfortably above both the 10- and 20-day. And non-commercials continue not to believe in the rally, with net shorts highest since October 2015. If a squeeze occurs, the journey to 3150 will be quick.
Euro: Currently net long 75.2k, up 2.7k.
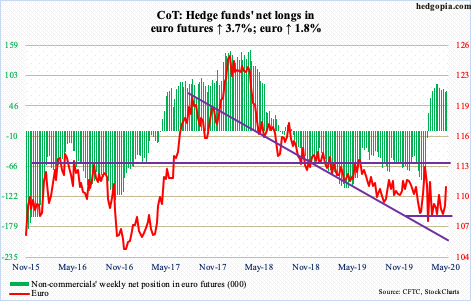
The European Commission on Wednesday proposed a €750-billion package to help the eurozone recover from the Covid-19 pandemic. It requires approval from the 27 national leaders and their parliaments. If approved, this will have opened a new chapter in the bloc’s history. All along, the wealthier nations have resisted the notion of collective debt, including during the 2008 financial crisis.
As things stand, Germany and France, the bloc’s two strongest countries, are backing the proposal, while the Netherlands, Austria, Denmark and Sweden – also known as the frugal four – oppose mutualization of debt. Of the €750 billion, €500 billion will be distributed as grants, with Italy and Spain probably getting the largest slices as their economies have been hit the hardest. The frugal four argues that the aid should instead come in the form of low interest rates.
The euro ($111) rallied on this. Last Friday, the 50-day was defended. Tuesday this week, the currency gapped up. By Thursday, the 200-day was reclaimed. With this, the euro has broken out of a two-month pennant.
The daily is beginning to look extended, but there is room to rally on the weekly. In the event of a pullback, $110 support is important. This is where the 200-day ($110.17) lies as well.
Gold: Currently net long 237.9k, down 13.9k.
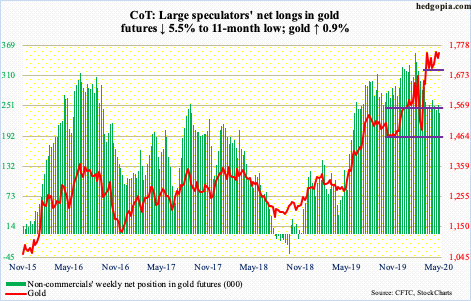
Gold bugs continued to send money to gold-focused ETFs, non-commercials continued to reduce net longs and the metal continued to trade sideways.
In the week to Wednesday, GLD (SPDR Gold ETF) and IAU (iShares Gold Trust) respectively took in $373 million and $74 million. This was the 10th straight week of positive flows, for combined inflows of $13.5 billion (courtesy of ETF.com). Non-commercials in the meantime reduced their net longs to an 11-month low.
Gold ($1,751.70/ounce) tried – once again – to decisively take out $1,750s, but did not quite make it, although it closed right at that resistance. At the same time, $1,700 drew bids both Tuesday and Wednesday. Consolidation continues. Right here and now, gold bugs deserve the benefit of the doubt.
Nasdaq 100 index (mini): Currently net long 3.4k, up 8.4k.
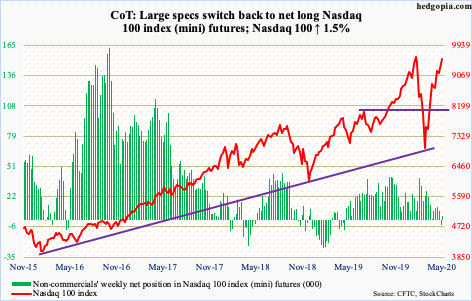
Flows into QQQ (Invesco QQQ Trust) have been positive for six straight weeks, for a total haul of $6.9 billion, including $1.2 billion in the week to Wednesday (courtesy of ETF.com).
Within a stone’s throw from its record high of 9736.57 from February 19th, the Nasdaq 100 is trading in a weird fashion (more on this here). Tuesday, it tagged 9570.53 intraday before reversing hard to form a red marubozu. Wednesday, bulls bought early weakness defending the 20-day but only to form a potentially bearish hanging man. Thursday, initial strength was sold and by close a gravestone doji showed up. Friday, the 10-day was defended to close the session – as well as the week – up 1.5 percent. This is coming at a time when 98 percent of Nasdaq 100 stocks were above the 50-day on Friday.
From the March 23rd low, the Nasdaq 100 (9555.52) has come a long way, up in excess of 41 percent through Tuesday’s high. For profit-taking to begin in earnest, bears need to reclaim shorter-term averages. They hope they can cash in on the weekly dragonfly doji this week. The potentially bearish candle needs confirmation. Otherwise, for a while now, bears have been unwillingly helping the bulls with their elevated short interest (more on this here).
Russell 2000 mini-index: Currently net long 28.8k, up 22.6k.
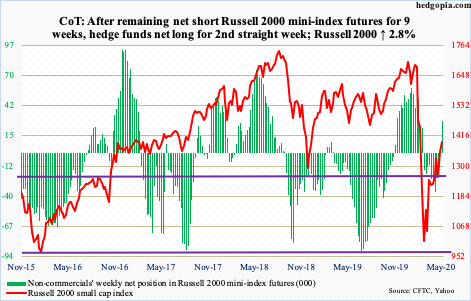
This week, the Russell 2000 joined the S&P 500 and the Nasdaq 100 to retrace more than 61.8 percent of their February-March declines. On the Russell 2000, the retracement lies at 1419. Thursday, the index rallied all the way to 1450.37 intraday but only to reverse hard and close at 1400.67. Friday, it came under more pressure to close the week at 1394.04. For the week, it still managed to rise 2.8 percent and was up seven percent at Thursday’s high.
Leading into this, in the week to Wednesday, both IWM (iShares Russell 2000 ETF) and IJR (iShares Core S&P Small-Cap ETF) witnessed outflows, losing $1.2 billion and $57 million (courtesy of ETF.com).
Nearest support on the Russell 2000 lies at 1330s, followed by 1250s.
US Dollar Index: Currently net long 14.8k, down 2.5k.
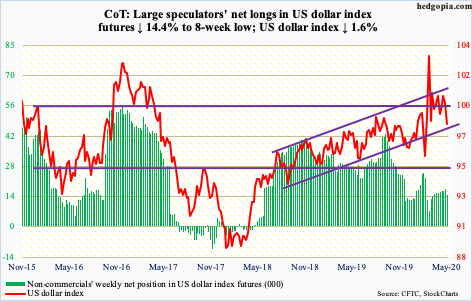
After repeatedly getting denied at five-year horizontal resistance at 100.50-101 in prior weeks, the US dollar index (98.34) this week lost straight-line support at 99. Friday, it tagged 97.93 intraday, losing the 200-day at 98.39, although the damage was minimized by close. There is dual support at 97.50s – straight line and lower bound of a two-year rising channel.
VIX: Currently net short 42.6k, up 7.6k.
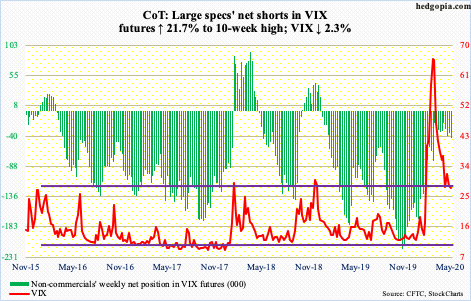
VIX (27.51) is seeing a lot of action just above the 200-day (24.37). Above, it remains bound by the 10- and 20-day, but at the same time volatility bulls have defended the daily lower Bollinger band, including Wednesday when a long-legged doji appeared right on it. A takeout of these averages (between 29 and 31) opens the door to a test of 37, which is where the upper Bollinger band rests.
Meanwhile, the CBOE equity-only put-to-call ratio continued to print frothy readings. The 21-day moving average ended the week at 0.581, with Thursday at 0.579. When fear ruled in March, this rose as high as 0.867 on the 20th. Now, the pendulum has swung the other way. Historically, mid- to high-0.50s signal elevated optimism (more on this here). The 10-day average ended the week at 0.524. Greed has taken over. On February 19th when the rug was pulled out from under stocks, the 10-day dropped to 0.501.
Thanks for reading!
