
Following futures positions of non-commercials are as of June 16, 2020.
10-year note: Currently net short 10.9k, down 13.1k.
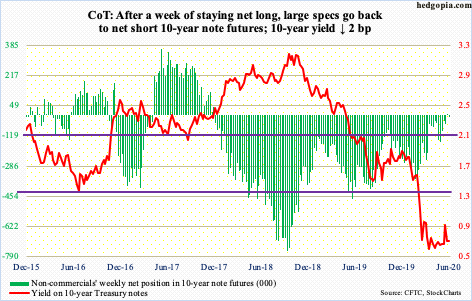
Foreigners are aggressively getting out of the US sovereign bond market. In March and April, they sold $475.6 billion in Treasury notes and bonds. In the 12 months to April, selling totaled $573.5 billion worth – a record.
Historically, foreigners’ purchases – or a lack thereof – have tended to move hand in hand with Treasury issuance. This time around, the two have diverged (more on this here). Twelve-month issuance of Treasury notes and bonds was to the tune of $1.01 trillion in March, with May at $992.9 billion. Given the persistently rising federal budget deficit, the trend in issuance is higher.
Enter the Federal Reserve, which is filling the void left by foreigners, and then some. As of Wednesday, it held $3.53 trillion in Treasury notes and bonds, up $1.5 trillion in just the last 14 weeks. That said, the rate of growth is decelerating, with a week-over-week rise of $15.6 billion this week versus a surge of $335.7 billion in the week to April 1st.
Concurrently, the Fed’s balance sheet contracted this week by $74.2 billion from last week’s record high $7.17 trillion. This was the first w/w drop in 16 weeks. Should this continue, with foreigners too being on the offer, interesting dynamics lie ahead in the long end of the yield curve. Logic would dictate this should put upward pressure on the rates, but can the Fed afford one, given the leverage in the system, including $26 trillion in federal debt – and counting?
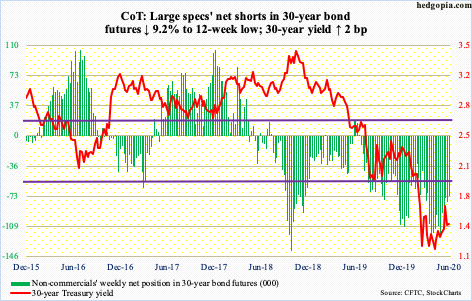
30-year bond: Currently net short 72.3k, down 7.3k.
Major economic releases next week are as follows.
Existing home sales (May) are due out Monday. In April, sales collapsed 17.8 percent month-over-month to a seasonally adjusted annual rate of 4.33 million units. In February, sales hit 5.76 million.
Tuesday brings new home sales (May). April sales inched up 0.6 percent m/m to 623,000 units. March’s 619,000 was a 10-month low and down substantially from 774,000 in January.
GDP (1Q20, final), corporate profits (1Q20, revised) and durable goods orders (May) are scheduled for Thursday.
The second estimate showed real GDP contracted at an annual rate of five percent in 1Q20. This was the first contraction is six years.
In 1Q20, corporate profits adjusted for inventory valuation and capital consumption declined 13.9 percent sequentially to $1.84 trillion (SAAR). Profits peaked as far back as 3Q14 at $2.19 trillion.
Orders for non-defense capital goods ex-aircraft – proxy for business capex plans – dropped 6.1 percent m/m to $61.6 billion (SAAR). This was the third straight m/m drop.
Personal income (May) and the University of Michigan’s consumer sentiment index (June, final) will be published Friday.
In the 12 months to April, core PCE (personal consumption expenditures) – the Fed’s favorite measure of consumer inflation – rose 1.04 percent. This was the slowest pace of growth in 111 months.
Preliminarily, consumer sentiment in June increased 6.6 points m/m to 78.9. May’s 72.3 matched July 2012’s reading.
WTI crude oil: Currently net long 677.3k, down 35k.
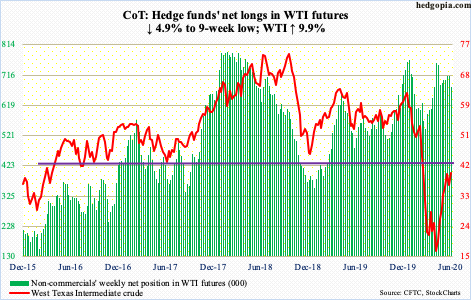
Last week, WTI ($39.83/barrel) filled a gap from three months ago, posting $40.44 on June 8th. Sellers quickly showed up after that. Both Friday last week and Monday this week, the crude dropped to the $34 handle. Support around this level goes back over three months. And that was defended. The price remains above the 10- and 20-day moving averages, although they have flatlined and will be rolling over unless bulls regain the momentum. Should things evolve this way, a breach of $34 opens the door to a test of $28-29.
The EIA report for the week to June 12th showed US crude production continued to drop – down 600,000 barrels/day to 10.5 million b/d. Production peaked in February/March at 13.1 mb/d. Crude imports fell as well, down 222,000 b/d to 6.6 mb/d. As did gasoline and distillate stocks, which decreased 1.7 million barrels and 1.4 million barrels to 257 million barrels and 174.5 million barrels, respectively. Refinery utilization edged up seven-tenths of a percentage point to 73.8 percent. Crude stocks, however, rose 1.2 million barrels to 539.3 million barrels – a record.
E-mini S&P 500: Currently net short 303.3k, up 75.2k.
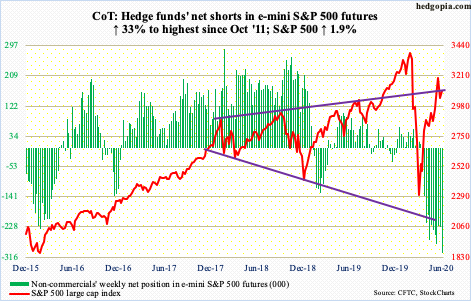
Last week, a potential island reversal top formed on the S&P 500 (3097.74), with Thursday’s big drop essentially landing the index right on the 200-day. Both last Friday and Monday this week, bears had an opportunity to decisively take out the average, but bulls stepped up right where they needed to. Monday’s intraday low of 2965.66 was essentially a successful breakout retest. They built on it further Tuesday, but with slowing momentum. The index currently is right at the top of a broadening wedge. Both the 10- and 20-day are flattish. Bears will cherish a rollover, so bulls need to act fast. Otherwise, profit-taking can begin (more on this here). As things stand, they are getting no help from flows.
In the week to Wednesday, $25.5 billion came out of US-based equity funds (courtesy of Lipper). In the same week, SPY (SPDR S&P 500 ETF), VOO (Vanguard S&P 500 ETF) and IVV (iShares Core S&P 500 ETF) collectively lost $3 billion (courtesy of ETF.com). A potential positive is that money-market funds have finally begun to shrink. After peaking at $4.79 trillion in the week to May 20th, they have gone down by $104.7 billion, dropping for four straight weeks. This is the so-called cash-on-the-sidelines. Should the recent trend persist, it is a potential tailwind for stocks should they get their fair share. But it is a big if, given how far stocks have moved from their March lows.
Euro: Currently net long 117.1k, up 21.5k.
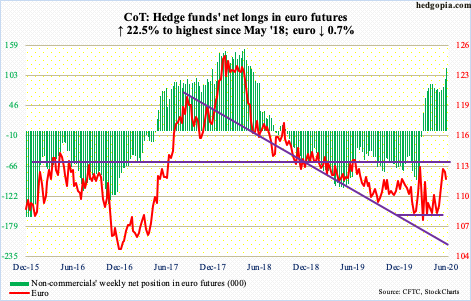
The June 10th spinning top session in which the euro ($111.79) tagged $114.25 intraday proved costly. By Friday this week, it was sitting right on support at $111.70s-80s. Both the 10- and 20-day have been lost. In the sessions ahead, the path of least resistance is toward $110, where a confluence of support lies – the 200-day at $110.31, the 50-day at $110.04 and horizontal just under $110.
Gold: Currently net long 224.3k, up 15.7k.
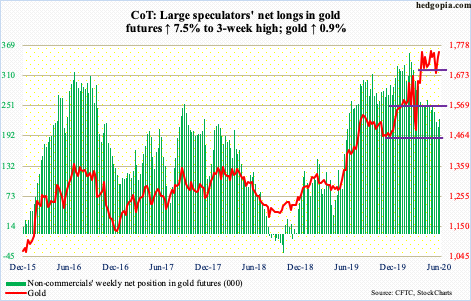
Reversing prior week’s loss of $188 million, GLD (SPDR Gold ETF) in the week to Wednesday gained $373 million. This was the 12th week of inflows in 13. IAU (iShares Gold Trust), on the other hand, attracted funds in all 13, including this week’s $85 million (courtesy of ETF.com).
Gold, in the meantime, continues to consolidate. Monday, gold bugs swooped in when it fell to $1,706.20 intraday. For three and a half months now, $1,700 – or just below – has persistently attracted bids.
Concurrently, the yellow metal has been unable to break through $1,750s. Friday, it tried again, with an intraday high of $1,760.90 but closing at $1,753/ounce. So, the longer this sideways action continues, the more the pent-up energy, and the more violent the move – either way it breaks. At this point, risk-reward odds probably favor gold bugs.
Non-commercials have been cutting back their net longs the past four months. In the face of this, gold hung in there. This week, these traders added a bit.
Nasdaq 100 index (mini): Currently net long 25.2k, up 15k.
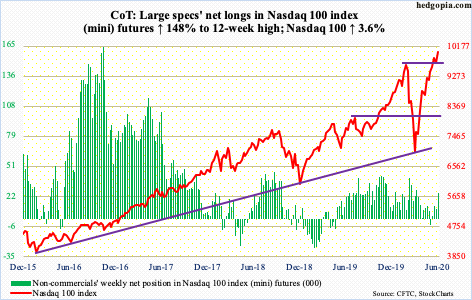
The low-volume grind higher continues. On June 10th, the Nasdaq 100 (10008.64) reached a new all-time high of 10155.20. That record stands, with Friday’s intraday high of 10121.67 a stone’s throw away, although by close it reversed strongly lower to end flat. Before this, last Friday as well as Monday this week, buyers showed up just under 9500, defending the 20-day (9728.89) and reclaiming the 10-day (9894.46) in subsequent sessions.
In the week to Wednesday, QQQ (Invesco QQQ Trust) gained $1.1 billion (courtesy of ETF.com), which obviously helped the index rally 3.6 percent this week. But amidst all this, one just does not sense a whole lot of conviction behind how the index acts. Bulls are yet to grant bears an opening, but risks are rising.
Russell 2000 mini-index: Currently net long 8.9k, down 1.5k.
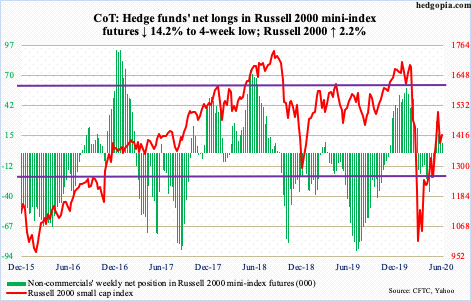
The June 8th high of 1537.62 kissed the upper bound of a three-month ascending channel, before coming under pressure. This preceded a 59-percent rally from the March 18th low of 966.22. After a move like this, digestion only makes sense. The only question is which way might the consolidation get resolved – breakout or breakdown?
For now, both bulls and bears are standing their ground. The index (1418.63) remains trapped between 1450s and 1330s. Both Tuesday and Wednesday, the upper end repelled rally attempts, while the lower end was successfully tested last Friday and Monday this week (more on this here). Immediately ahead, a test of 1330s is more likely than a 1450s breakout.
US Dollar Index: Currently net short 5.3k, up 10k.
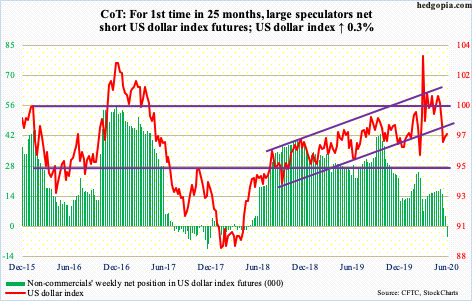
Wednesday last week, the US dollar index (97.58) dropped to 95.71 intraday to kiss the daily lower Bollinger band. Support just north of 95 goes back over five years. By Thursday this week, it was testing 97.50s, with Friday edging slightly past the 20-day at 97.48. The 200-day lies at 98.30.
VIX: Currently net short 51.8k, down 15.6k.
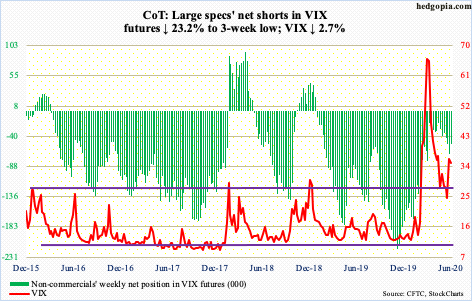
No sooner did Monday’s intraday high of 44.44 surpass last Friday’s high of 44.16 than VIX reversed hard with a red marubozu. In the next three sessions, the volatility index (35.12) went sideways hugging the 50-day (33.14), even as rally attempts were denied at 36-37.
For volatility bulls, the only solace is the fact that there is now a potentially bullish crossover between the 10- and 20-day. Friday, intraday weakness stopped just above the 20-day and by close the 50-day was reclaimed. Before anything comes out of this, 36-37 needs to be recaptured, which could happen in the sessions ahead.
In the meantime, investors continue to exude froth in the options market. The 21-day moving average of the CBOE equity-only put-to-call ratio printed 0.497 on Tuesday. This was the lowest since January 2011. This is as giddy as it could get. Unwinding – a matter of when, not if – will leave behind a trail of pain. Friday ended at 0.504.
Thanks for reading!
