
Following futures positions of non-commercials are as of August 18, 2020.
10-year note: Currently net long 87k, up 81.5k.
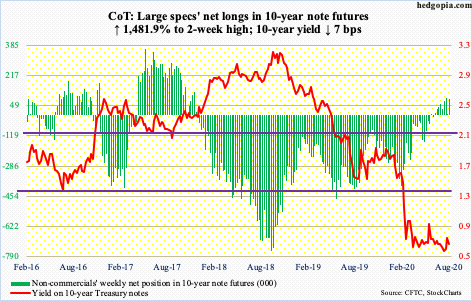
Last Thursday’s intraday high of 0.73 percent just about tested the upper bound of a five-month range, in which rates went back and forth between 0.74 percent and 0.57 percent. This week, the 10-year Treasury yield (0.64 percent) shed seven basis points; odds favor it is headed lower.
FOMC minutes for the July 28-29 meeting released Wednesday showed policymakers were concerned that an economic recovery would need stimulus measures for a far longer period.
The 10-year closed out the week right on the 50-day moving average. A breach opens the door to a test of the lower bound. There is room for the rates to continue lower on the daily. Longer-term, range breakout is a likely scenario should foreigners continue to dump Treasury notes and bonds and should the Fed continue to reduce the pace of its purchases of these securities (more on this here).
30-year bond: Currently net short 144.7k, down 7.7k.

Major economic releases next week are as follows.
The S&P/Case-Shiller home price index (June) and new home sales (July) come out Tuesday.
Nationally, US home prices rose 4.5 percent year-over-year in May. This is slight deceleration from April’s 4.6-percent pace, which was a 17-month high.
Sales of new homes jumped 35.9 percent from April to June to a seasonally adjusted annual rate of 776,000 units, which was the highest since July 2007.
Durable goods (July) are scheduled for Wednesday. June orders for non-defense capital goods ex-aircraft – proxy for business capex plans – increased 3.4 percent month-over-month and fell 3.2 percent y/y to $64.3 billion (SAAR). This was the fourth straight y/y decline.
GDP (2Q20, second estimate) and corporate profits (2Q20, preliminary) are due out Thursday.
The advance estimate showed real GDP collapsed 32.9 percent in 2Q. This was preceded by a five-percent slide in 1Q.
Corporate profits adjusted for inventory valuation and capital consumption dropped 12.3 percent quarter-over-quarter to $1.87 trillion.
Friday brings personal income/spending (July) and the University of Michigan’s consumer sentiment index (August, final).
In the 12 months to June, core PCE, which is the Fed’s favorite measure of consumer inflation, rose 0.95 percent – third straight month of sub-one percent growth.
Preliminarily in August, consumer sentiment edged up three-tenths of a point m/m to 72.8. April’s 71.8 was the lowest since December 2011.
WTI crude oil: Currently net long 600.9k, down 22.4k.

After several tries, WTI ($42.34/barrel) edged past the 200-day on Monday. Thursday, the average was lost intraday, but oil bulls showed up near the 20-day to reclaim it by close. These two averages, along with the 10- and 50-day, are separated by only $1.53.
The crude is coiled. Having rallied from a low of $6.50 on April 21, it has come a long way. At the same time, it has essentially gone sideways for nearly two months now. Bulls would like to think this is digestion of the gains before a new leg higher. Bears would equate this to a loss of momentum. On Tuesday, Thursday and Friday this week, a hanging man was formed. This is potentially bearish but needs confirmation.
A loss of the 50-day at $40.68 opens the door to a test of $34-35. Should the 200-day ($42.21) decisively give way, bulls will be eyeing $48-49.
In the meantime, US crude production in the week to August 14 remained unchanged at 10.7 million barrels per day. Production peaked at 13.1 mb/d in February and March. Crude imports increased 109 b/d to 5.7 mb/d. Distillate stocks rose as well, up 152,000 barrels to 177.8 million barrels. Stocks of crude and gasoline, on the other hand, dropped 1.6 million barrels and 3.3 million barrels respectively to 512.5 million barrels and 243.8 million barrels. Refinery utilization edged down one-tenth of a percentage point to 80.9 percent.
E-mini S&P 500: Currently net short 64.8k, down 1.1k.
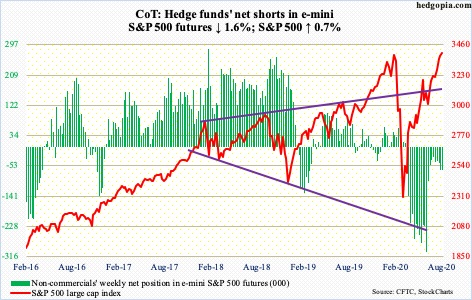
In the week to May 20, US money market funds peaked at $4.79 trillion. This week, they stood at $4.54 trillion. A year ago, they were $3.35 trillion (courtesy of ICI). Bulls consistently point out that this amounts to potential buying power for stocks.
When these assets peaked in May, the S&P 500 was sub-3000. This week, it closed at 3397.16. Although it is not clear if the reduction in these funds helped. From the week to May 20 through this week, $54.1 billion left US-based equity funds (courtesy of Lipper). During the period, SPY (SPDR S&P 500 ETF), VOO (Vanguard S&P 500 ETF) and IVV (iShares Core S&P 500 ETF) collectively gained $5.5 billion (courtesy of ETF.com).
Historically, stocks have tended to get their fair share as money market funds shrink. This so-called cash-on-the-sidelines remains massive. The problem is, those that remained in cash saw a massive rally unfold the past five months without them in it, so it likely takes a lot to convince them to jump on the bullish bandwagon now.
Would a new high on the S&P 500 be the catalyst? This week, the index surpassed the prior high from February 19, essentially completing a V-shaped recovery. Despite the new high, there is not a whole lot of conviction. Volume remains anemic. It increasingly feels like bulls are spending a lot of energy not to lose momentum. It is their ball to lose.
Euro: Currently net long 196.9k, down 2.8k.
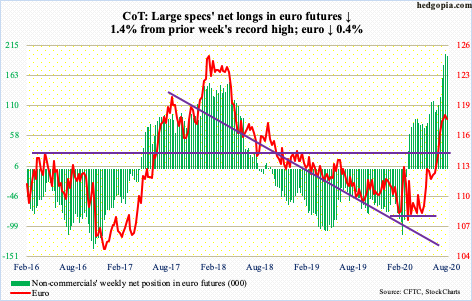
Euro bulls continued to attack 17-year-plus resistance at $1.19-1.20. Tuesday’s intraday high of $1.197 eclipsed the prior high of $1.906 from two weeks ago but building on it proved difficult. By Thursday, it tagged $1.1803, testing the 20-day. The 10-day is flattish to slightly down and a cross-down looks imminent. Friday, the averages were lost.
This will have come after a strong rally post-March 20 bottom at $1.064. Immediately ahead, there is support at $1.17, followed by trend-line support at $1.16 (more on this here). Then there is horizontal support at $1.145.
Gold: Currently net long 223.5k, down 535.
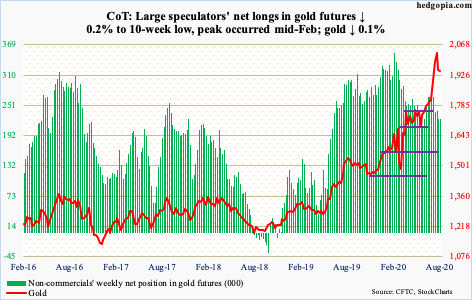
Despite wild price action after hitting $2,089.20 on the 7th this month, money has continued to move into IAU (iShares Gold Trust), which in the week to Wednesday took in another $143 million, for a 22-week haul of $6.8 billion. GLD (SPDR Gold ETF) witnessed two down weeks during that time, for a collective take of $18.3 billion (courtesy of ETF.com).
In contrast, non-commercials of late have not been as enthusiastic. They are still net long 223,518 contracts but held as many as 353,649 mid-February.
Gold ($1,947/ounce) has come a long way the past six months, bottoming at $1,450.90 on March 16 and surpassing the prior high of $1,923.70 from September 2011 three weeks ago.
Since the high two weeks ago, the yellow metal is giving out signs of distribution. Breakout retest at $1,920s has held so far. Bears are likely to continue to hammer on this in the sessions ahead. A potentially bearish 10- and 20-day cross-under just completed on the daily.
Even if $1,920s give way, gold bugs can still defend the 50-day at $1,870.17. Worse, there is strong support at $1,750s-60s.
Nasdaq 100 index (mini): Currently net long 21.2k, up 8.7k.
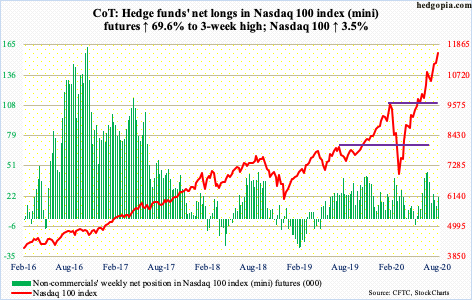
In the week through Wednesday, QQQ (Invesco QQQ Trust) gained $2 billion. This was the highest weekly inflows in six weeks. This got put to good use as the Nasdaq 100 (11555.16) rallied 3.5 percent this week.
On August 6, the index retreated slightly after hitting 11282.24. Selling stopped at the 20-day nine sessions ago. The subsequent rally resulted in a new high this Monday, followed in the next three sessions by defense of that mini-breakout. Friday, yet another high was posted. As frustrating as this is for the bears, 11300 is now the new level to watch.
Russell 2000 mini-index: Currently net long 13.7k, down 1.4k.

Just north of 1600 has proven to be a crucial price point going back to January 2018. Bulls lost this level when the February-March selloff was just getting underway. By March 18, the Russell 2000 tagged 966.22, before rallying the next five months to test – you guessed it – 1600-plus.
Tuesday last week, the Russell 2000 (1552.48) tagged 1603.60 intraday, with session highs in three of the remaining four sessions of 1590s. However, the ceiling would not crack (more on this here). Early this month, the index began to lift off of 1450s-60s, which it broke out of mid-July. In due course, this support may now act like a magnet.
US Dollar Index: Currently net short 7.5k, down 667.
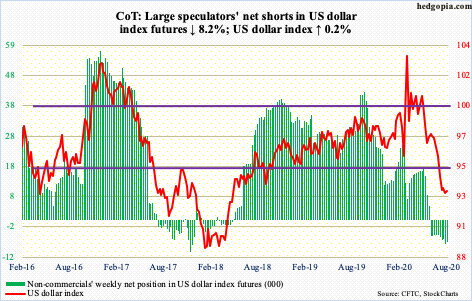
The lows of late July and early this month were breached Tuesday as the US dollar index (93.27) dropped to 92.14 intraday. This was the lowest since May 2018 and was a test of the daily lower Bollinger band. Bids showed up the very next day.
The 10-day is flattish and is on the verge of crossing over the 20-day. This is potentially bullish. Month-to-date, rally attempts have been denied at 93.90s. The advantage dollar bulls will have this time around is that the index will have captured both the 10- and 20-day by then.
Just north of 94 also lies the underside of the broken rising trend line from May 2011. This month’s high was rejected at this breached line.
VIX: Currently net short 97k, up 3.1k.
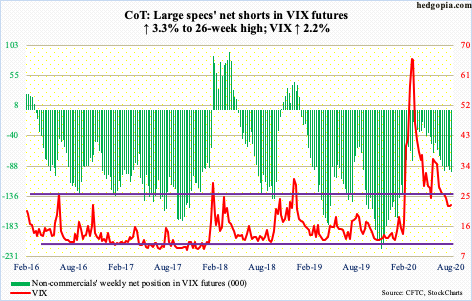
This was the third week in a row VIX (22.54) touched the 20 handle and rallied. Wednesday’s intraday drop to 20.99 found support at the daily lower Bollinger band, which lies at 20.79. The upper band is at 25.48, meaning the spread is quite narrow. Concurrently, the 50- and 200-day have converged – respectively at 27.23 and 27.70. At the same time, only 0.80 separate the 10- and 20-day, with both beginning to wear a flattish look.
On the weekly, last week was a spinning top, this week a long-legged doji. This comes after the massive volatility compression since VIX peaked at 85.47 in March. Stars may be beginning to align for volatility bulls. This week, the index rallied 2.2 percent even though the S&P 500 rallied 0.7 percent – a rare occurrence.
Thanks for reading!
