
Following futures positions of non-commercials are as of August 25, 2020.
10-year note: Currently net long 72.3k, down 14.7k.
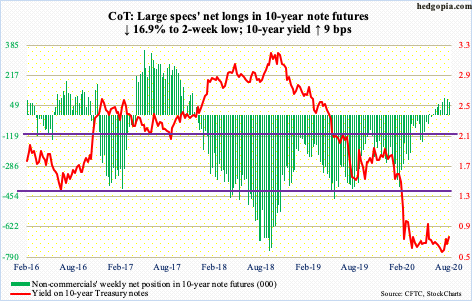
The 10-year Treasury yield (0.73 percent) is itching to break out of a five-and-a-half-month rectangle between 0.57 percent and 0.74 percent. Thursday, rates jumped six basis points in a volatile session to 0.75 percent, as the 10-year took a cue from Fed Chair Jerome Powell’s inflation comments at Jackson Hole.
The Fed has now adopted an “average inflation target”, under which it will seek to achieve inflation that averages two percent over time. This is a major shift in policy and likely means it is ready to leave interest rates where they are, which is zero-bound, for a long time.
The central bank wants inflation and would not mind if it exceeds two percent. A cynic might say this is an attempt to inflate away the nation’s heavy debt load. The US national debt stands at $26.7 trillion – and growing. Given the ongoing massive budget deficit, God knows where the debt burden is headed. Inflation will help erode its real value.
Rates will have to cooperate for this. A clean range breakout likely results in the 10-year heading back toward the June 5th intraday high of 0.96 percent. But if inflation expectations perk up as well, rates will not stop there. And in a leveraged economy, this will cause a problem, slowing things down and putting downward pressure on inflation – not what the Fed wants.
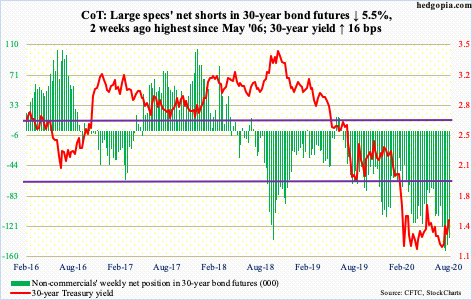
30-year bond: Currently net short 136.8k, down 7.9k.
Major economic releases next week are as follows.
The ISM manufacturing index (August) comes out Tuesday. Manufacturing activity in July rose 1.6 points month-over-month to 54.2 – a 16-month high. This was the third m/m increase after the index hit 41.5 in April.
Durable goods orders (July, revised) are scheduled for Wednesday. Preliminarily, July orders for non-defense capital goods ex-aircraft – proxy for business capex plans – increased 1.9 percent year-over-year to a seasonally adjusted annual rate of $66.1 billion. This was the third up month in a row after orders bottomed at $61.3 billion in April.
Labor productivity (2Q20, revised) and the ISM non-manufacturing index (August) will be published Thursday.
The preliminary estimate showed non-farm output per hour increased 2.15 percent y/y in 2Q20. This was the fastest pace in 21 quarters.
Services activity in July was up a point m/m to 58.1 – a 17-month high. In April, the non-manufacturing index hit 41.8.
Friday brings the employment report (August). After losing 22.2 million non-farm jobs between February’s record 152.5 million and April’s 130.3 million, the economy added 9.3 million jobs to July’s 139.6 million.
WTI crude oil: Currently net long 579.3k, down 21.6k.
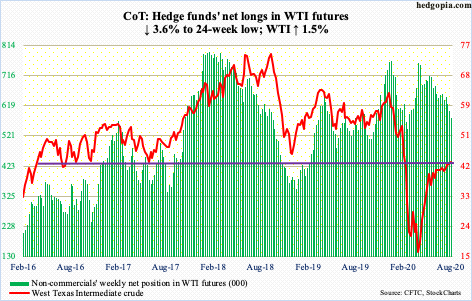
WTI ($42.97/barrel) continued to trade around its important moving averages. Merely $0.66 lies between the 50-day (slightly rising) and the 200-day (slightly falling). Likewise, only $0.56 separate the 10-day with the 20-day ($42.41). The crude is coiled.
WTI has come a long way, having rallied from a low of $6.50 on April 21. It has essentially gone sideways the past couple of months with a slight upward bias. Wednesday’s intraday high of $43.78 was the highest since March 6 and it came in a doji session. Monday and Friday were doji sessions as well.
As this indecision continues, a loss of the 50-day at $41.21 opens the door to a test of $34-35, while a decisive takeout of the 200-day at $41.87 will have raised the odds of a march toward $48-49.
Meanwhile, US crude production in the week to August 21 increased 100,000 barrels per day to 10.8 million b/d. Crude imports rose as well, up 186,000 b/d to 5.9 mb/d. As did distillate stocks, which grew 1.4 million barrels to 179.2 million barrels. Stocks of crude and gasoline, on the other hand, fell – respectively by 4.7 million barrels and 4.6 million barrels to 507.8 million barrels and 239.2 million barrels. Refinery utilization rose 1.1 percentage points to 82 percent.
E-mini S&P 500: Currently net short 86.6k, up 21.8k.
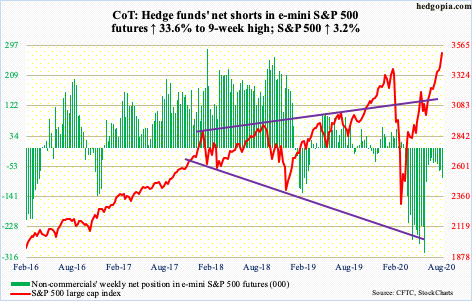
With one session to go, August is up 7.2 percent – for a back-to-back monthly marubozu. This will be a 5th straight positive month after the S&P 500 bottomed in March. From that low, the index is up 60 percent! Shorts have provided a helping hand (chart here).
Several metrics are extended, with the daily RSI of 79.3 Friday. The index (3508.01) continues to pull further and further away from its 200-day; Friday, the gap was 13.8 percent, which was the widest since late January 2018.
As bulls enjoy this amazing run, logic dictates the temptation to lock in profit – at least some – grows as the index pushes higher. This week, it cleanly broke out of its February high. Despite this, US-based equity funds lost another $7.8 billion in the week to Wednesday (courtesy of Lipper), while SPY (SPDR S&P 500 ETF), VOO (Vanguard S&P 500 ETF) and IVV (iShares Core S&P 500 ETF) collectively lost $1.7 billion (courtesy of ETF.com).
Amidst this, the genuineness – and durability – of this week’s breakout will only be confirmed if bulls aggressively step up and defend 3390s when a test occurs.
Euro: Currently net long 211.8k, up 14.8k.
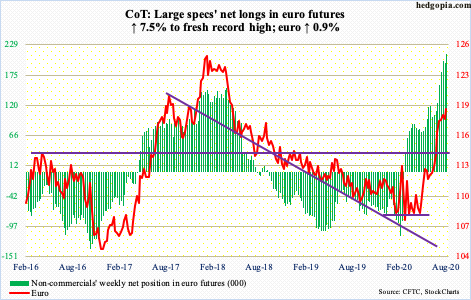
The euro ($1.191) continues to trade in a sideways pattern, which it has done for a month now. This came after the currency broke out of a falling trend line from April 2008 when it peaked at $1.602. The breakout soon met with resistance at 17-plus-year horizontal line at $1.19-1.20. Nine sessions ago, it tagged $1.197.
Euro bulls are not giving up, though. From their perspective, the good thing is that nearest support at $1.17 has held. Friday, they were able to reclaim the 10- and 20-day, which otherwise looked like they were setting up for a cross-down.
Non-commercials are betting the $1.19-1.20 ceiling eventually falls. This week, they raised net longs to yet another record.
Gold: Currently net long 221k, down 2.5k.
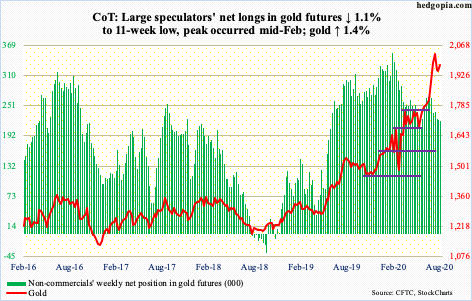
Flows are beginning to stall. In the week to Wednesday, another $105 million moved into IAU (iShares Gold Trust), for a 23-week haul of $6.9 billion. During that time, GLD (SPDR Gold ETF) witnessed three down weeks, two of which came in the last three, including this week’s outflows of $22 million; altogether, $18.2 billion came into the ETF during those 23 weeks (courtesy of ETF.com).
The break in what has been an aggressive pattern of inflows followed a peak in gold ($1,974.90/ounce) on the 7th this month at an intraday high of $2,089.20. The metal has come a long way the past five and a half months, bottoming at $1,450.90 on March 16 and surpassing the prior high of $1,923.70 from September 2011 a month ago. The breakout was tested several times this week – successfully. There is room for the daily to rally.
Nasdaq 100 index (mini): Currently net long 19.7k, down 1.5k.
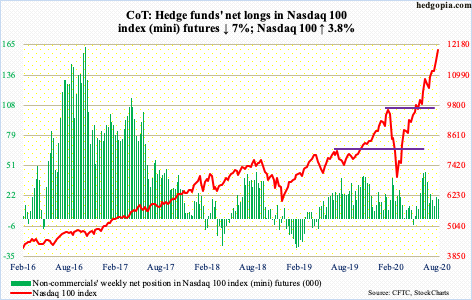
Thursday, the Nasdaq 100 (11995.85) hit another intraday high of 12047.99 but not before reversing slightly to end the session down 0.4 percent. For the week, it added another 3.8 percent. From the March low, the index is up nearly 78 percent!
Sentiment-wise, the NAAIM Exposure Index this week rose 6.43 points week-over-week to 106.56 – third straight 100-plus reading. This was also the highest print since December 2017. NAAIM represents professional money managers. Elsewhere, Investors Intelligence bulls hit 60 percent this week – a 99-week high (more on this here). These are newsletter writers.
Tech has proven to be the go-to sector since the March low. It is safe to assume that both these groups are heavily into tech, and they have done well. This also means there is lot of gains on the paper, waiting to be rung up. The technically oriented ones therefore will be watching shorter-term averages, with the 10- and 20-day at 11628.04 and 11371.29 respectively. After that, 11000 bears watching.
Russell 2000 mini-index: Currently net long 18.3k, up 4.6k.
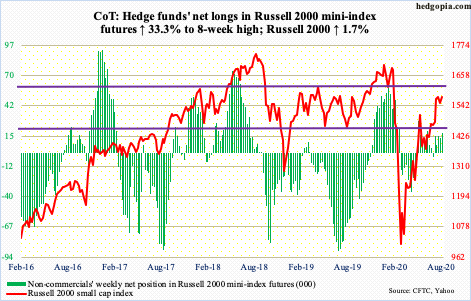
It increasingly feels like small-cap bulls have run out of steam. The rejection three weeks ago at 1600-plus, which has proven to be a crucial price point going back to January 2018, could prove to be major. Time will tell. This week, rally attempts repeatedly stopped at 1570s.
All this followed a massive rally after the Russell 2000 small cap index (1578.34) bottom-ticked 966.22 on March 18. In due course, the index likely wants to retest 1450s-60s, which it broke out of in the middle of July.
US Dollar Index: Currently net short 7.8k, up 258.
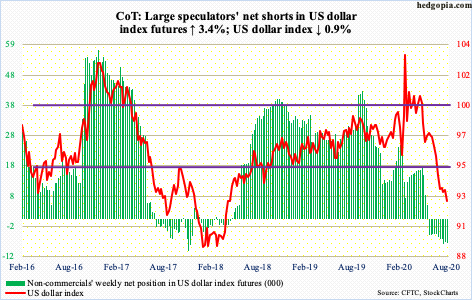
For a month now, the US dollar index (92.39) has gone sideways with bids consistently showing up at the 92 handle. Support just north of 92 goes back at least 17 years.
This preceded a retreat beginning March 23 when the index peaked at 103.96 intraday. As a result of the one-month consolidation, both the 10- and 20-day are flattish. A potentially bullish crossover looked imminent, with the index essentially sitting on the averages for several sessions – until Friday when a 0.7-percent drop pushed it clinging on to the 92 support. It is a must-save.
VIX: Currently net short 98.2k, up 1.2k.
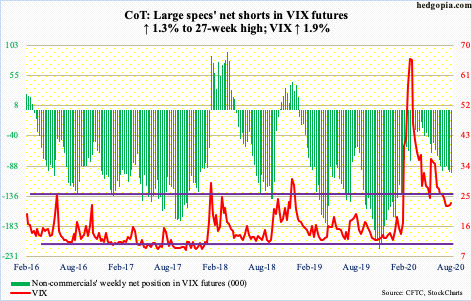
Throughout this month, VIX (22.96) held 20. The lowest print was recorded on the 11th when 20.28 was hit intraday. This week’s low was Wednesday’s 20.92. Both Wednesday and Thursday, the volatility index rallied in the face of up sessions for the S&P 500, which does not happen often. Normally, the two tend to go the opposite way. However, in both those sessions, VIX was rejected at the 50-day. This gives volatility bears an opportunity to try to push VIX lower near term.
In the meantime, the 21-day moving average of the CBOE equity-only put-to-call ratio reached 0.446 on Friday – another low. Frothy is getting frothier. There will a lot of tears shed when this thing reverses and goes the other way. Until then, volatility compression continues.
Friday, the ratio of VIX to VXV closed at 0.775, which was the lowest since January 2018 (more on this here). This metric is extremely oversold. As and when unwinding begins, demand rises for nearer-term protection, which is VIX in this case. Once again, exceptions aside, VIX and the S&P 500 tend to have an inverse relationship.
Thanks for reading!
