Following futures positions of non-commercials are as of Sep 12, 2017.
10-year note: Currently net long 251.7k, up 29.9k.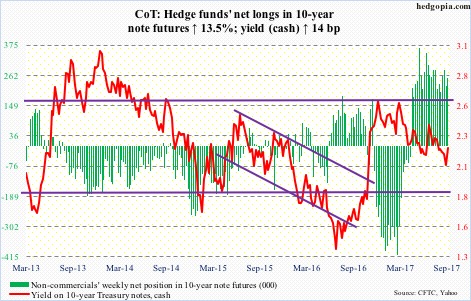
The FOMC’s two-day meeting begins Tuesday. A press conference by Janet Yellen, Fed chair, is scheduled for Wednesday. After this, there will be two more meetings left this year – one in October/November (31-1) and the other December (12-13).
This week’s meeting is a foregone conclusion as far as interest rates are concerned. Markets do not expect a hike, and the Fed is not going to surprise them. They, however, do expect details of the Fed’s plan to shrink its massive $4.5-trillion balance sheet. Depending on what is said – and not said – this can be a market-moving event.
Markets are also likely to move if Wednesday’s statement and/or Ms. Yellen before the press drop a hint or two as to if a hike is imminent in December, which does have a press conference scheduled.
Currently, markets are pricing in 56-percent odds of a 25-basis-point hike in December. Core inflation remains subdued, and that is what they are focused on. As does the Fed. It continues to shoot for a two-percent target on core PCE – its favorite measure of consumer inflation. The last time this metric grew north of two percent year-over-year was in April 2012, with July at 1.41 percent.
The outlook for interest rates will have changed if and when the Fed’s focus shifts to jobs, let alone asset inflation.
30-year bond: Currently net long 50.5k, down 1.8k.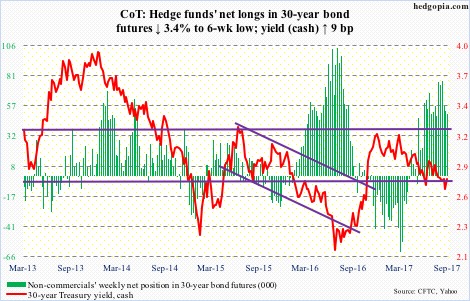
Major economic releases next week are as follows.
Monday brings the NAHB housing market index (September) and the Treasury International Capital data (July).
Builder sentiment rose four points month-over-month in August to 68, three points below March’s 71, which was the highest since June 2005.
Year-to-June, foreigners net-purchased $53.3 billion in U.S. stocks. On a 12-month rolling total basis, June saw purchases of $94.4 billion. This is quite a U-turn from February last year when they sold $142 billion worth – a record.
Housing starts for August are due out Tuesday. Starts in July dropped 4.8 percent m/m to a seasonally adjusted annual rate of 1.16 million units. Starts reached 1.33 million units last October – the highest since August 2007.
August’s existing home sales come out Wednesday. July was down 1.3 percent m/m to 5.44 million units (SAAR). The cycle high – as well as a decade high – 5.7 million units was reached in March this year.
Crude oil: Currently net long 357.1k, down 5.8k.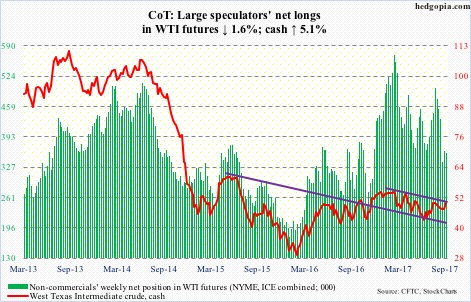
U.S. refined products continued to decline in the week to September 8. The weekly EIA report showed gasoline stocks dropped 8.4 million barrels to 218.3 million barrels, and distillates 3.2 million barrels to 144.6 million barrels.
Refinery utilization dropped another two percentage points to 77.7 percent. Two weeks ago, utilization was 96.6 percent.
Crude imports fell 603,000 barrels/day to 6.48 million b/d. Three weeks ago, they were 8.79 mb/d.
Crude production rose 572,000 to 9.35 mb/d, but still down from 9.53 mb/d two weeks ago.
Crude stocks rose 5.9 million barrels to 468.2 million barrels. They peaked at 535.5 million barrels in the week ended March 31.
Spot West Texas Intermediate crude ($49.89/barrel), after five consecutive weekly losses, rallied for the second straight week. Thursday, it rallied past the 200-day moving average, but sellers did show up on trend-line resistance from February this year. The $50 level also makes up the neckline of a potentially bullish inverse head-and-shoulders. A genuine breakout will be significant – should one occur.
E-mini S&P 500: Currently net long 188k, up 30.1k.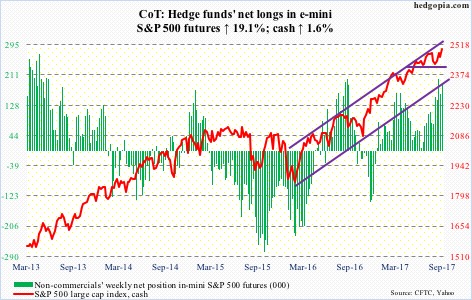
Yet another high on the cash.
The August 8 high of 2490.87 was surpassed Tuesday. The new number to beat: Friday’s all-time high of 2500.23.
The breakout – rather meek – has come without newsletter writers fully on board. In the latest week, Investors Intelligence’s bullish percent was 47.1 percent – a 10-month low.
What happens with the flows likely determine if the bulls are able to build on this week’s action. In the week to Wednesday, flows into S&P 500-focused ETF’s were positive.
A combined $3.2 billion moved into SPY (SPDR S&P 500 ETF), VOO (Vanguard S&P 500 ETF) and IVV (iShares core S&P 500 ETF) – $3.1 billion, $91 million and $36 million, respectively (courtesy of ETF.com).
In the same week, $410 million came out of U.S.-based equity funds (courtesy of Lipper).
Intraday between the low of August 21 and Friday’s high, the S&P 500 rallied 3.4 percent. The daily chart is extended. Nearest support lies at 2480, and after that 2455-2460.
Euro: Currently net long 86.1k, down 10.3k.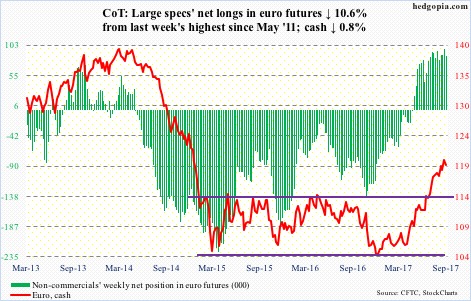
Euro bulls and bears continued to wrestle over control of shorter-term moving averages.
On the daily chart, toward the end of the week, indicators such as the RSI and CCI turned up from the median. This is an opportunity for the bulls to step up and push the price higher. The cash ($119.45) peaked on September 8 at $120.69.
Else, odds favor the bears – at least near term.
The currency had a major breakout in July this year – out of $114.50. Even if this level is tested in due course, a successful breakout retest keeps the bullish thesis intact.
Gold: Currently net long 254.8k, up 9.5k.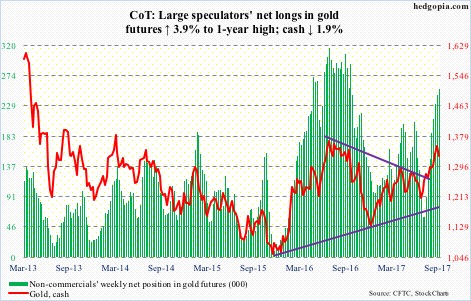
The cash ($1,325.2/ounce) has been under pressure since reversing from $1362.40 on September 8, which just about tested the intraday high of $1,377.50 on July 6.
Concurrently, a potentially bullish multi-year inverse head-and-shoulders was in play, which, at least for now, has been negated.
Of late, flows have been very healthy into gold-focused ETF’s. In the five weeks ended Wednesday, GLD (SPDR gold ETF) took in $2.2 billion, and IAU (iShares gold trust) $396 million (courtesy of ETF.com).
Gold bugs must be hoping these longs do not run out of patience. Risk rises if they are unable to defend $1,300, which the yellow metal broke out of two weeks ago. This support goes back to September 2010.
Nasdaq 100 index (mini): Currently net long 47.6k, up 3.4k.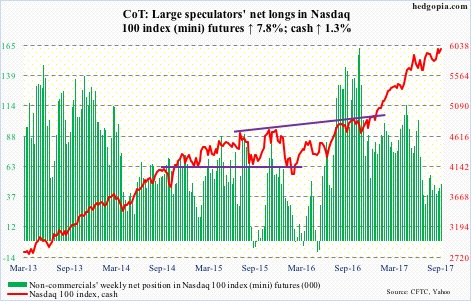
The cash (5988) had a strong week, but struggled at 6000. The all-time high of 6009.61 was reached on September 1. The bulls since have hammered on that resistance several times.
Apple (AAPL), which makes up north of 12 percent of the Nasdaq 100, peaked on September 1 as well, and has been under slight pressure since. The release of the new iPhone was no help. A lot is riding on the iPhone X, and at $999 and higher, it likely prices out many a potential buyer.
On the daily chart, the Nasdaq 100 is extended. Even if a breakout occurs next week, it likely will be difficult to hold, particularly if flows do not cooperate.
In the week to Wednesday, ETF.com shows, $180 million came out of QQQ (PowerShares QQQ trust).
Russell 2000 mini-index: Currently net short 102.3k, up 20k.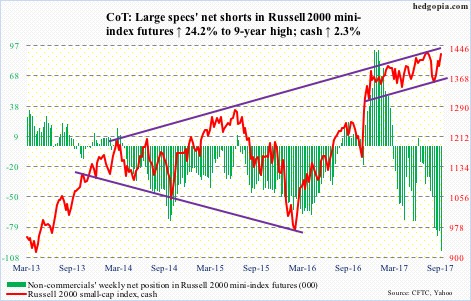
The White House met with key members of Congress this week to discuss overhauling of the tax code. They are yet to put forth a detailed plan. Speaker Paul Ryan said an outline would be unveiled during the work week beginning September 25. Real battle lies ahead.
Small-caps inherently are domestically focused and likely get a bigger bang for the buck from tax cuts.
That said, unlike its major U.S. peers that are at/near new highs, the Russell 2000 (cash) remains nearly 20 points below the July 25 all-time high of 1452.09.
After rallying 6.1 percent intraday between August 18 and Friday, the index probably is in need of unwinding its daily overbought condition. Nearest support lies at 1407 (50-day) and 1390s.
In the week to Wednesday, per ETF.com, $166 million came out of IWM (iShares Russell 2000 ETF). If flows improve and the bulls are able to press the Russell 2000 higher, the odds of a squeeze are rising.
Non-commercials’ net shorts are at a nine-year high.
US Dollar Index: Currently net short 2.2k, down 1.8k.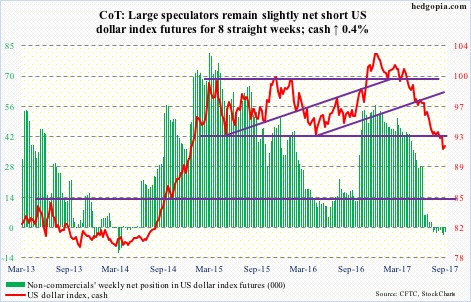
One more week in which dollar bulls were unable to take out shorter-term moving averages on the cash (91.65). Wednesday, the 20-day resisted rally attempts, Friday the 10-day. The session’s high of 92.52 also approximated short-term horizontal resistance at 92.60.
Support at 92, which goes back to at least 1998, is crucial, even as non-commercials continue to show disinterest in building net longs.
VIX: Currently net short 123.8k, up 2.5k.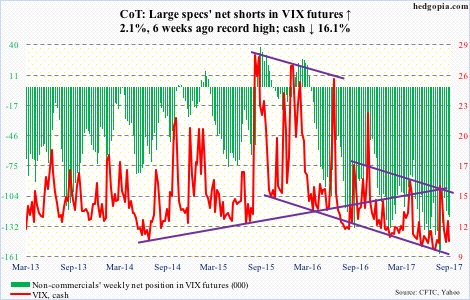
The count is now 12 out of 19. That is the number of sessions the CBOE equity put-to-call ratio closed in the .50s. This metric is very complacent near term.
Not surprisingly, VIX (cash) dropped into the 10’s and remained there all week, with Thursday’s attempt to rally rejected at the 10-day.
Thanks for reading!

