
Following futures positions of non-commercials are as of December 8, 2020.
10-year note: Currently net long 29.2k, up 3.4k.

The FOMC meets next week. The two-day meeting ends on Wednesday with a press conference by Chair Jerome Powell. This is the last meeting of the year. Not a whole lot is expected to come out of this.
At least judging by how equities are performing, the US economy is expected to rapidly get back to normal next year, which might argue for less monetary stimulus from the Fed. However, speaking at a virtual conference a few days after positive vaccine news from Pfizer (November 9) and Moderna (November 16), Mr. Powell said “widespread vaccination is months into the future.”
The US economy is still far from returning to pre-pandemic levels of activity. Translation: markets can stay reassured that the easy monetary policy is here to stay.
If anything, Mr. Powell may even suggest the economy is in need of more support. For a while now, Fed officials have stressed the need for fiscal stimulus, but Congress cannot seem to agree on a new spending bill. Of late, US economic data has softened. This gives the Fed an excuse to get proactive, should it so desire.
30-year bond: Currently net short 230.4k, down 4.6k.

Major economic releases for next week are as follows.
Industrial production (November) and Treasury International Capital data (October) are due out Tuesday.
Capacity utilization in October was down 5.5 percent year-over-year to 72.8 percent. This was a seven-month high and much higher versus April’s low of 64.2 percent.
In the 12 months to September, foreigners purchased $234.4 billion in US equities – the most ever.
Retail sales (November) and the NAHB housing market index (December) are scheduled for Wednesday.
Retail sales edged up 0.3 percent in October to a seasonally adjusted annual rate of record $553.3 billion. In April, sales languished at $412.8 billion.
In November, homebuilder optimism increased five points m/m to 90 – a new record and three times the April reading of 30.
Thursday brings housing starts (November). In October, starts rose 4.9 percent m/m to 1.53 million units (SAAR) – an eight-month high. Earlier in April, starts were down to 934,000 units.
WTI crude oil: Currently net long 556.3k, down 4k.
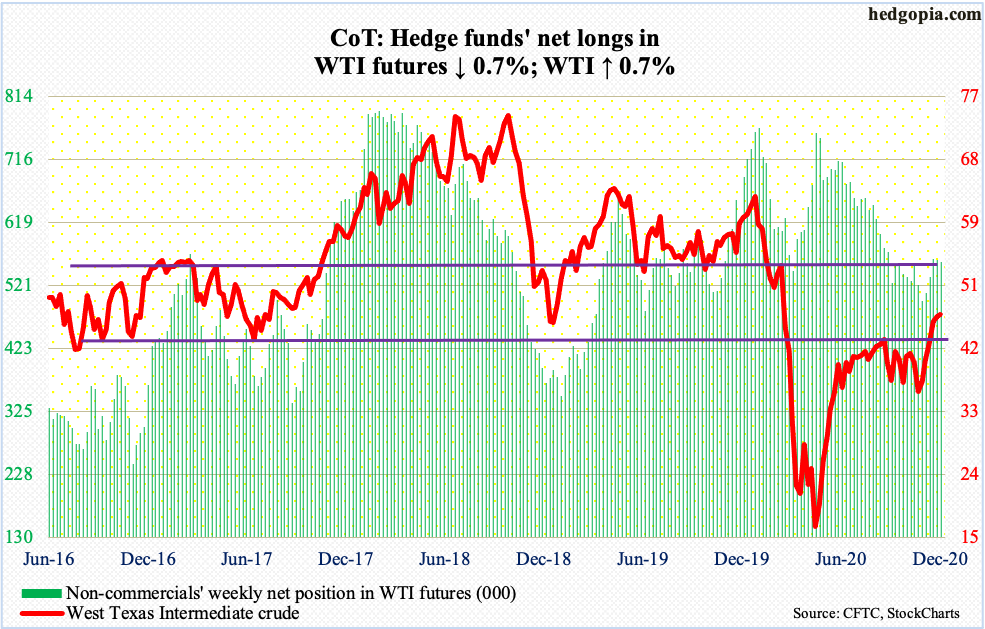
In the week to December 4, per the EIA, US crude production was flat at 11.1 million barrels per day. Crude imports, however, rose 1.1 mb/d to 6.5 mb/d. As did stocks of crude, gasoline and distillates, which were respectively up 15.2 million barrels, 4.2 million barrels and 5.2 million barrels to 503.2 million barrels, 237.9 million barrels and 151.1 million barrels. Refinery utilization increased 1.7 percentage points to 79.9 percent.
The sizable rise in crude stocks had little effect on traders’ willingness to own WTI ($46.57/barrel). Oil bulls further built on the $42-$43 breakout from three weeks ago. On Wednesday last week, the breakout was retested. Ideally, bulls would like to go test $49-$50. On Thursday this week, the crude rose to $47.74 intraday, but the session’s candle left a long upper shadow, with a weekly spinning top to boot.
The daily is getting extended. In the event of selling pressure, bulls need to save $42-$43.
E-mini S&P 500: Currently net short 42.7k, up 18.3k.
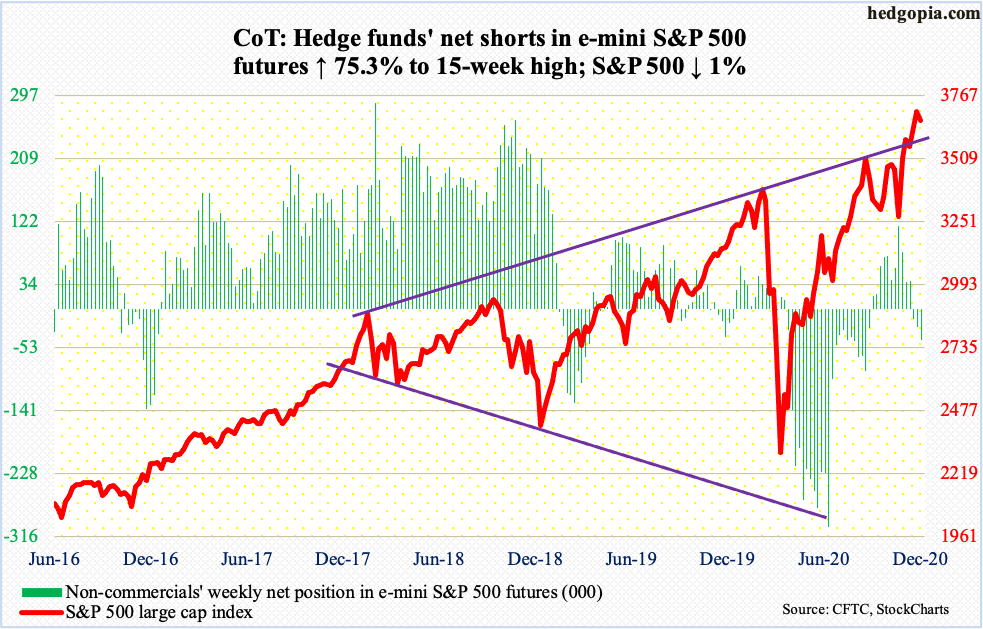
After four weeks of inflows totaling $39.8 billion, US-based equity funds bled $5.4 billion in the week to Wednesday (courtesy of Lipper). In the same week, SPY (SPDR S&P 500 ETF), VOO (Vanguard S&P 500 ETF) and IVV (iShares Core S&P 500 ETF) collectively lost $11.1 billion; this was the most weekly outflows since late February this year (courtesy of ETF.com). Back then, the S&P 500 had just begun to come under pressure and the selloff continued for another three weeks.
This week, the large cap index (3663.46) shed one percent. On Wednesday, it rallied to a fresh intraday high of 3712.39 but only to end the session down 0.8 percent. On Thursday, it opened down another 0.8 percent, but the weakness was bought at 3640s. This was the high from November 9 when Pfizer announced its positive vaccine news. Again on Friday, bulls showed up at the 20-day moving average (3636.37). Once this level is breached, bulls likely will try to defend 3580s, which is where the S&P 500 peaked on September 2. A loss of these two price points can swing near-term momentum to bears’ favor.
Euro: Currently net long 156.4k, up 16.5k.

On Thursday, the ECB announced further asset purchases, adding another €500 billion to its €1.35-trillion emergency bond-buying program and extending it to March 2022. Markets were expecting this, so there was no element of surprise. The euro ($1.2111) rallied 0.5 percent in that session. A day earlier, bulls defended the 10-day.
Just last week, the currency broke out of major resistance at $1.19-$1.20. This ceiling goes back to May 2003. Euro bulls hammered on this for four months before it cracked.
The euro has come a long way. In March, it bottomed at $1.0635. Post-last week’s breakout, it quickly rallied to test the next level of resistance at $1.21-$1.22. Thursday last week, it tagged $1.2176. A takeout of this resistance can open the door to a test of $1.25. Else, the daily is overbought, with the weekly forming a spinning top this week.
Gold: Currently net long 269.2k, up 8.9k.
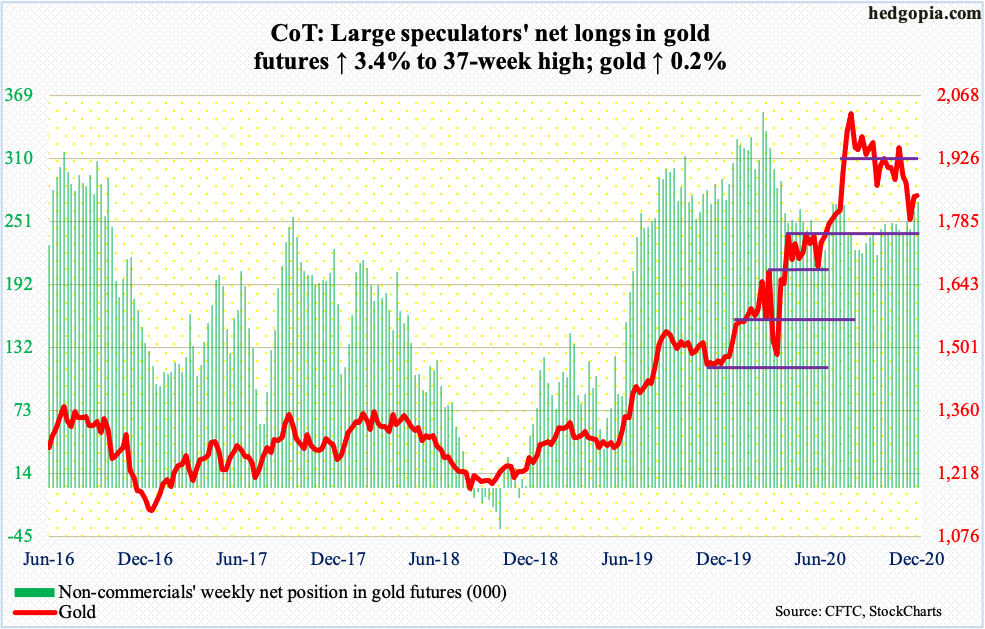
The defense of $1,750s two Mondays ago culminated in the reclaiming of $1,850s early this week. Tuesday, gold ($1,843.60/ounce) went on to post $1,879.80 intraday to unsuccessfully test its 50-day ($1,878,87). The 200-day lies at $1,812.95, and a test looks imminent. Late last month, the metal lost that average for a couple of sessions before gold bugs stepped up to save $1,750s. In due course, this level likely gets tested again.
GLD (SPDR Gold ETF) continues to bleed. In the week to Wednesday, $654 million was redeemed. This was the eighth straight weekly outflows for total withdrawals of $5.8 billion. Even then, the ETF is still up $14 billion since late March, when gold bottomed at $1,450.90. In those 38 weeks, IAU (iShares Gold Trust) experienced three weekly outflows, for a total haul of $8.3 billion, including $99 million in the week to Wednesday (courtesy of ETF.com).
Nasdaq 100 index (mini): Currently net long 9.1k, up 31.7k.
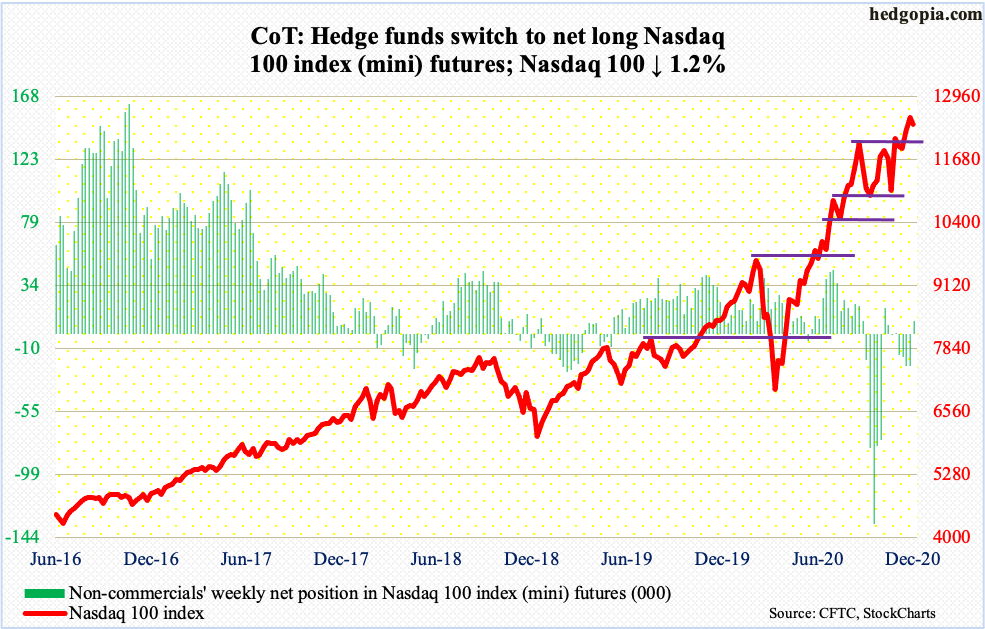
On Tuesday, the Nasdaq 100 (12375.41) rallied to a new intraday high of 12651.35 but only to come under pressure in the very next session. Selling continued Thursday, which tech bulls used as an opportunity to buy at the 20-day. This occurred again on Friday.
The 10-day approximates the prior high of 12439.48 from September 2. Psychologically, this is an important price point, which longs need to recapture the sooner the possible. Else, unwinding of overbought conditions can begin.
Russell 2000 mini-index: Currently net long 27.2k, down 11.4k.

On Wednesday, the Russell 2000 (1911.70) posted a fresh intraday high of 1935.27 but small-cap bulls were unable to hang on to the gains, with the session ending down 0.8 percent. It is a subtle sign of fatigue, but it is too soon to make too much out of this (more on this here). In the very next session, bids showed up at near-term support at 1880s, which attracted bids several times this week.
Near term, 1880s is the one to watch, and 1850s after that. It is only after these two levels are breached do the bears have a shot at 1740s, which bulls will fight tooth and nail to save. In August 2018, the small cap index peaked at 1740s. This level fell on November 16 when Moderna (MRNA) announced its positive vaccine news. Earlier on November 9 when Pfizer (PFE) announced its, bulls decisively pulled away from 1600-plus, which had been a roadblock since January 2018.
Since the November 3 presidential election, and particularly since vaccine news from PFE and MRNA, small-caps have been treated as a go-to sector. On Tuesday, the Russell 2000 was 31.1 percent away from its 200-day – the widest gap ever. Needlessly to say, things are extremely overbought. Unwinding can begin anytime. Hence the importance of 1880s and 1850s.
US Dollar Index: Currently net short 6.5k, up 3.4k.
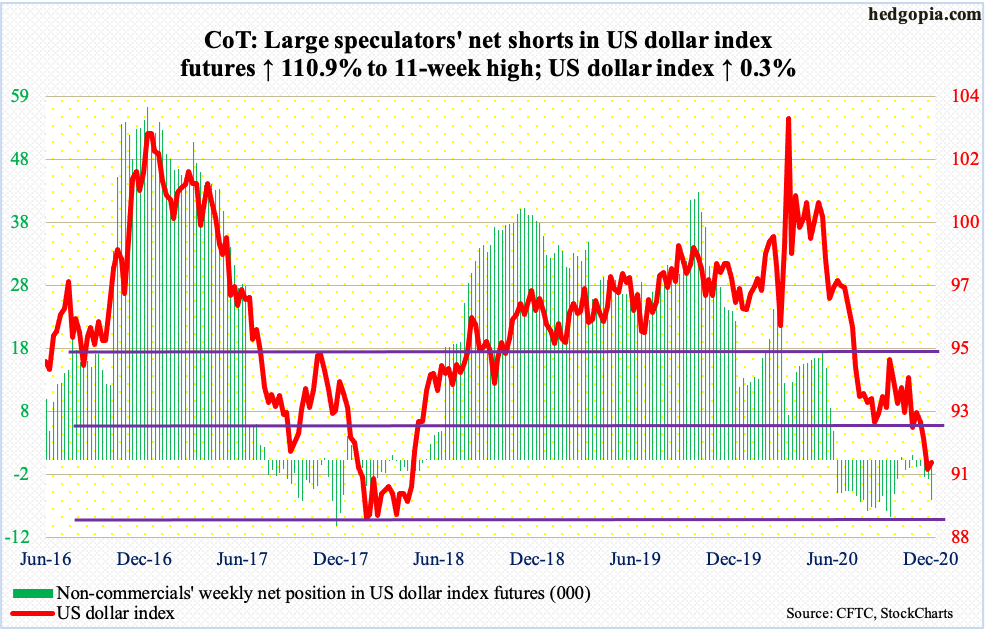
Last Friday’s intraday low of 90.47 is intact. This Friday, the US dollar index (90.92) made a slightly higher low of 90.55. On Wednesday through Friday, rally attempts stopped at the 10-day. More sideways action is probably needed before the average begins to cooperate. In this scenario, the dollar index can rally to 92 to see if the breakdown from late November is genuine. This support-turned-resistance goes back to at least June 2003. Inability to stabilize, and hold last Friday’s low, raises the risk it is eyeing multi-year horizontal support at 88-89.
VIX: Currently net short 99.8k, up 8.9k.

Volatility bulls have successfully held the line at 20, even though the S&P 500, and other major equity indices, keep making new highs. Over the last 11 sessions, VIX (23.31) went sub-20 twice but only intraday; in both those instances, the volatility index managed to close above 20.
This week, rally attempts were denied at the 20-day on both Monday and Tuesday, but by Thursday both the 10- and 20-day were recaptured. There is room for the daily to continue higher. The 50-day at 26.29 approximates resistance at mid-20s, which resisted Friday’s rally attempt with a session high of 25.14.
In the meantime, the 21-day moving average of the CBOE equity-only put-to-call ratio made yet another low of 0.42 on Thursday. Options are reflecting tons of greed (more on this here).
Thanks for reading!
