
Following futures positions of non-commercials are as of March 16, 2021.
10-year note: Currently net long 4.1k, up 50.2k.
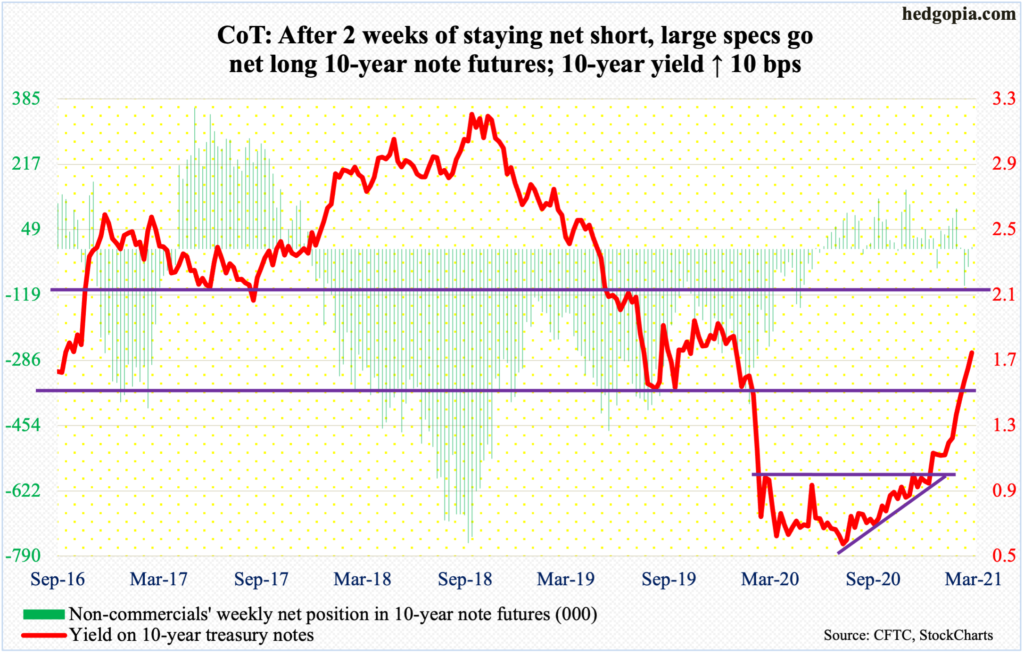
The FOMC left the benchmark rate between zero and 25 basis points this week. Also left unchanged was the asset buying program at $120 billion/month. This was expected. What was probably unexpected was members’ expectation not to raise rates through 2023. They concurrently raised real GDP growth forecast to 6.5 percent this year, up from 4.2 percent last December; core PCE inflation forecast went from 1.8 percent to 2.2 percent. The Fed continues to believe the pickup in inflation is transitory; it is expected to moderate next year.
It is hard to put two and two together, but it is what it is. Markets are confused. On Wednesday, the S&P 500 reversed early losses to close up slightly higher, but only to get smacked down on Thursday as the 10-year yield rose as high as 1.76 percent. Long rates have been perking up for a while. Short rates are behaving but are likely to force the Fed to change its interest rate forecast at some point in the future.
It increasingly feels like the Fed is looking for reasons to remain easy. It has a dual mandate – maximum employment and price stability. Under Alan Greenspan, whose era lasted from August 1987 to January 2006, policy focus also shifted to financial markets, which both Ben Bernanke and Janet Yellen gave continuity. The tradition has continued under Jerome Powell. Of late, we are increasingly beginning to hear members talk about income inequality. They are juggling too many balls in the air, and are already walking a tightrope (more on this here).
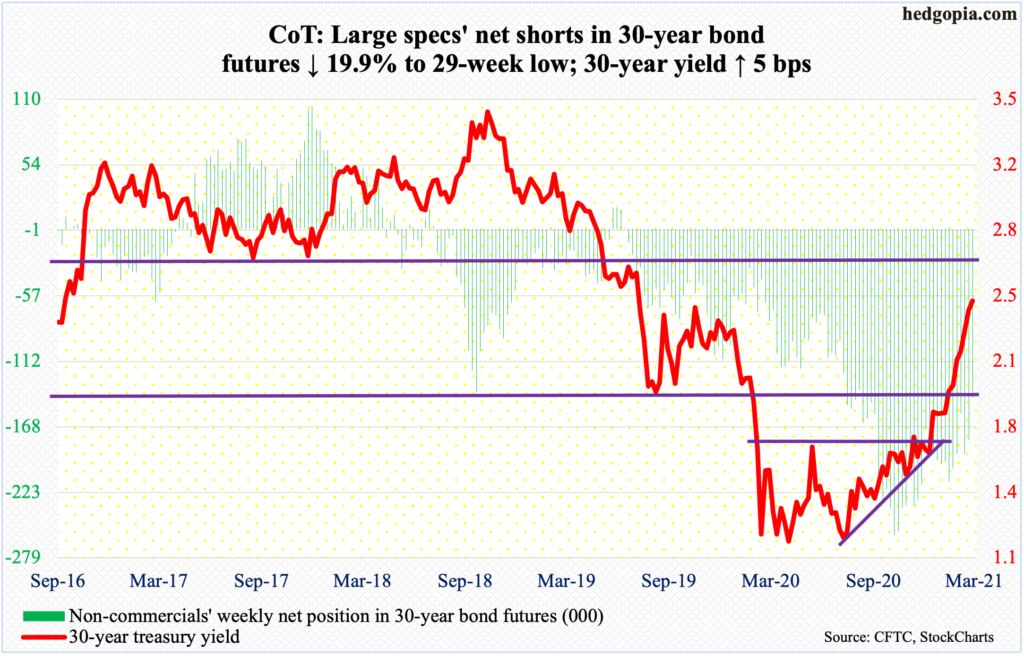
30-year bond: Currently net short 143.2k, down 35.6k.
Major economic releases for next week are as follows.
Existing home sales (February) are due out Monday. Sales in January inched up 0.6 percent month-over-month to a seasonally adjusted annual rate of 6.69 million units – a three-month high.
New home sales (February) will be published Tuesday. In January, sales rose 4.3 percent m/m to 923,000 units (SAAR) – a three-month high.
Durable goods orders (February) are scheduled for Wednesday. Orders for non-defense capital goods ex-aircraft – proxy for business capex plans – jumped 9.1 percent in the 12 months to January to $72.9 billion (SAAR) – a record.
GDP (4Q20, final) will be printed on Thursday. The second estimate showed 4Q20 real GDP grew 4.1 percent. This followed back-to-back contraction of five percent in 1Q and 31.4 percent in 2Q and growth of 33.4 percent in 3Q.
Friday brings personal income/spending (February) and the University of Michigan’s consumer sentiment index (March, final).
Core PCE (personal consumption expenditures), which is the Fed’s favorite measure of consumer inflation, increased 1.53 percent year-over-year in January – a four-month high.
March’s preliminary estimate showed consumer sentiment rose 6.2 points m/m to 83 – a one-year high.
WTI crude oil: Currently net long 564.4k, down 3.1k.
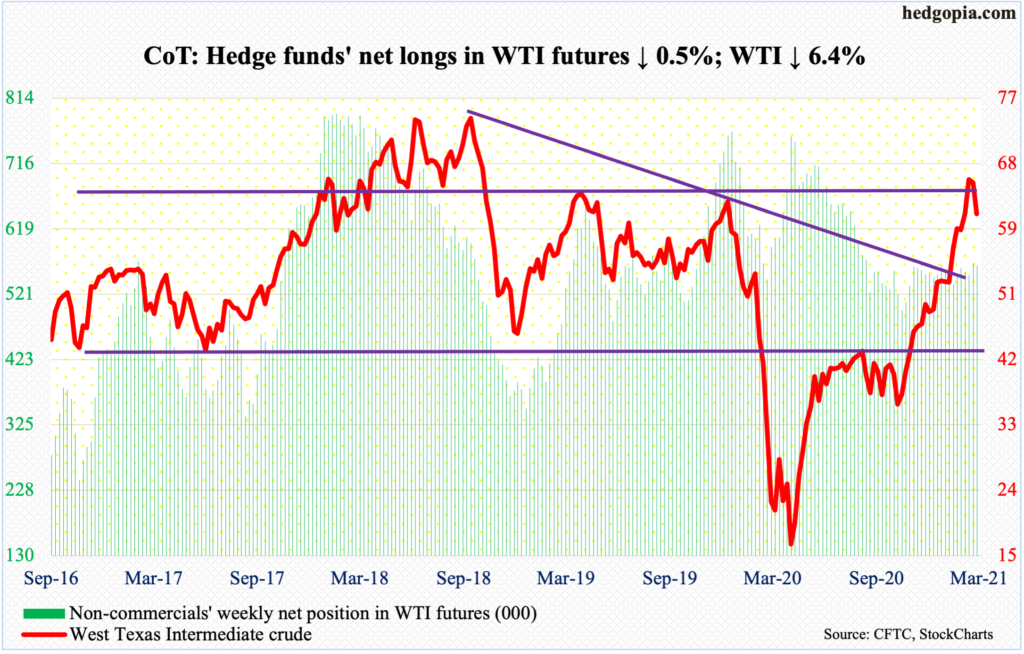
After last week’s spinning top and signs that the weekly was itching to unwind its overbought condition, WTI ($61.44/barrel) this week dropped 6.4 percent, dropping 7.1 percent on Thursday alone before bids showed up at the 50-day ($58.35). The average is intact. As is a rising trend line from early November last year, although it was breached at Thursday’s low. More downward pressure probably lies ahead. The next decent support is not until $52, or just north of there.
In the week to March 12, US stocks of crude, gasoline and distillates all increased – up 2.4 million barrels, 472,000 barrels and 255,000 barrels to 500.8 million barrels, 232.1 million barrels and 137.7 million barrels respectively. The EIA report also showed refinery utilization jumped 7.1 percentage points to 76.1 percent. Crude production was unchanged at 10.9 million barrels per day, but imports dropped 332,000 b/d to 5.3 mb/d.
E-mini S&P 500: Currently net short 4.2k, up 22k.
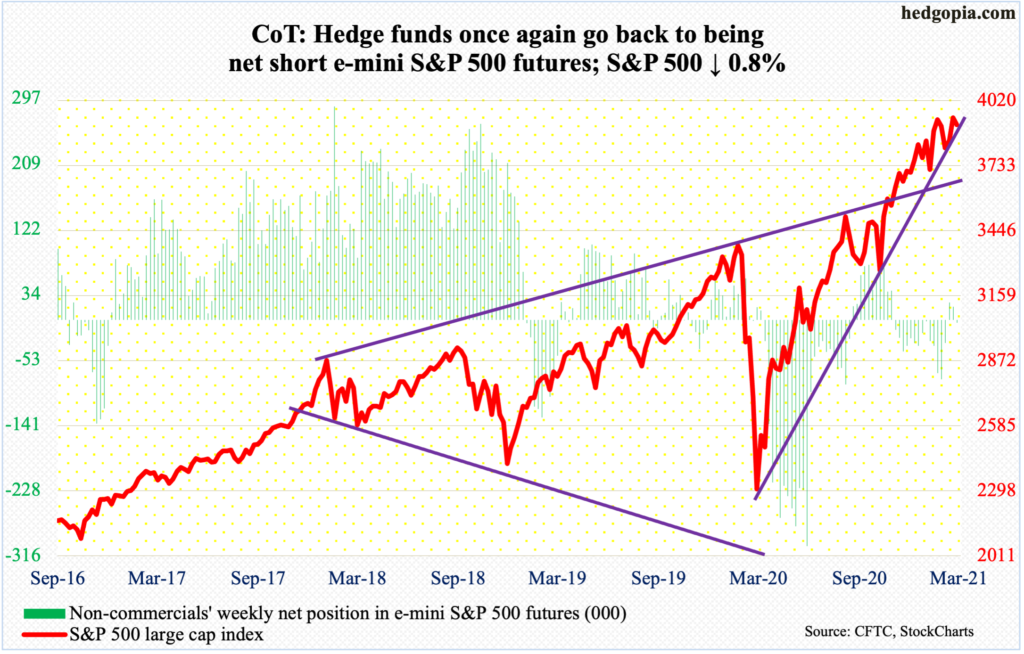
Once 3950s gave way on Monday (more on this here), bulls quickly tried to shift into a higher gear, but rally attempts were cut short on Wednesday after the S&P 500 tagged a new intraday high of 3983.87 – a little shy of the round number 4000.
In the week to Wednesday, flows continued to cooperate, with US-based equity funds drawing in another $18.3 billion, for a six-week uninterrupted haul of $86 billion (courtesy of Lipper). In the same week, SPY (SPDR S&P 500 ETF), VOO (Vanguard S&P 500 ETF) and IVV (iShares Core S&P 500 ETF) lost $3.3 billion (courtesy of ETF.com).
The S&P 500 (3913.10) closed out the week right on a rising trend line from last March. Since late January, this support has been repeatedly tested; this progressively occurs at higher price points. Early this month, the trend line was lost intraday but saved by close, even as the 50-day was lost intraday in a couple of sessions. Odds again favor a test in the sessions ahead.
Euro: Currently net long 90k, down 12k.
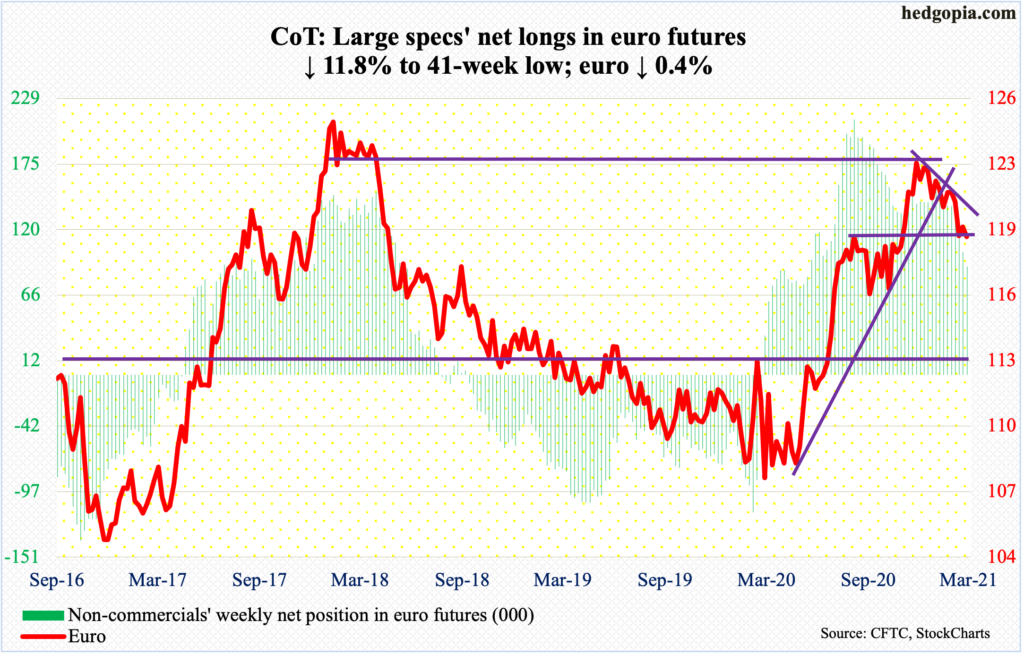
The ECB said it may give eurozone banks more time to rebuild capital so they can better deal with the expected increase in non-performing loans. Last year, post-pandemic, banks were given regulatory relief, even as dividend payments were frozen or capped. This is expected to be lifted at the end of September. This will depend on how the economy evolves.
On Wednesday, the euro ($1.1907) once again retreated after tagging $1.1989 intraday. Four sessions before that, it tagged $1.1992. Resistance at $1.20-$1.21 goes back more than 17 years.
From euro bulls’ perspective, the good thing is that the intraday low of $1.1843 from the 8th is intact, which now approximates the 200-day at $1.1833. Once $1.20 falls, the 50-day lies right above at $1.2072.
Gold: Currently net long 180.2k, up 5k.
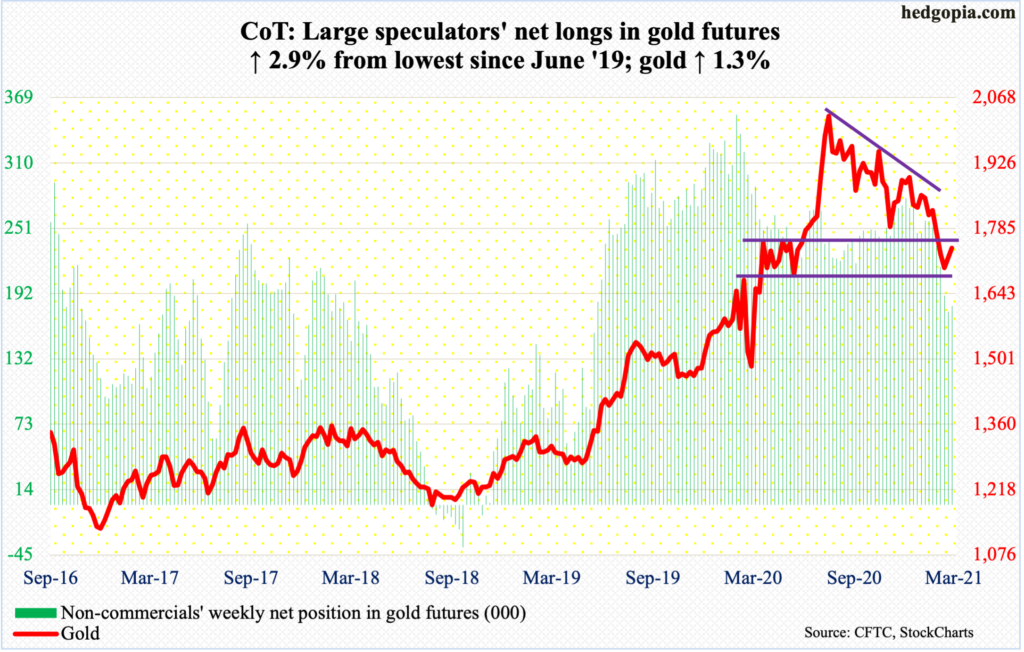
GLD (SPDR Gold ETF) continued to experience outflows, losing $661 million in the week to Wednesday (courtesy of ETF.com). Outflows began to pick up speed in the week to October 21 last year. In the 22 weeks since, 19 saw redemptions, for a cumulative loss of $13.3 billion (courtesy of ETF.com).
Despite this, gold bugs held their ground this week, as the metal rallied 1.3 percent – a back-to-back up week.
Gold ($1,741.70/ounce) reached its all-time high of $2,089.20 on August 7 last year. The subsequent selloff stopped on March 8 after the yellow metal tagged $1,673.30. There is horizontal support at $1,670s. The action since that low has been encouraging. Last week produced a weekly spinning top. Gold has now rallied for two weeks in a row.
Real test lies ahead at $1,760s-$1,770s, which was lost at the end of February. Thursday’s high of $1,754.20 just about tested this – unsuccessfully – but more tests probably lie ahead.
Nasdaq 100 index (mini): Currently net short 12.3k, down 167.
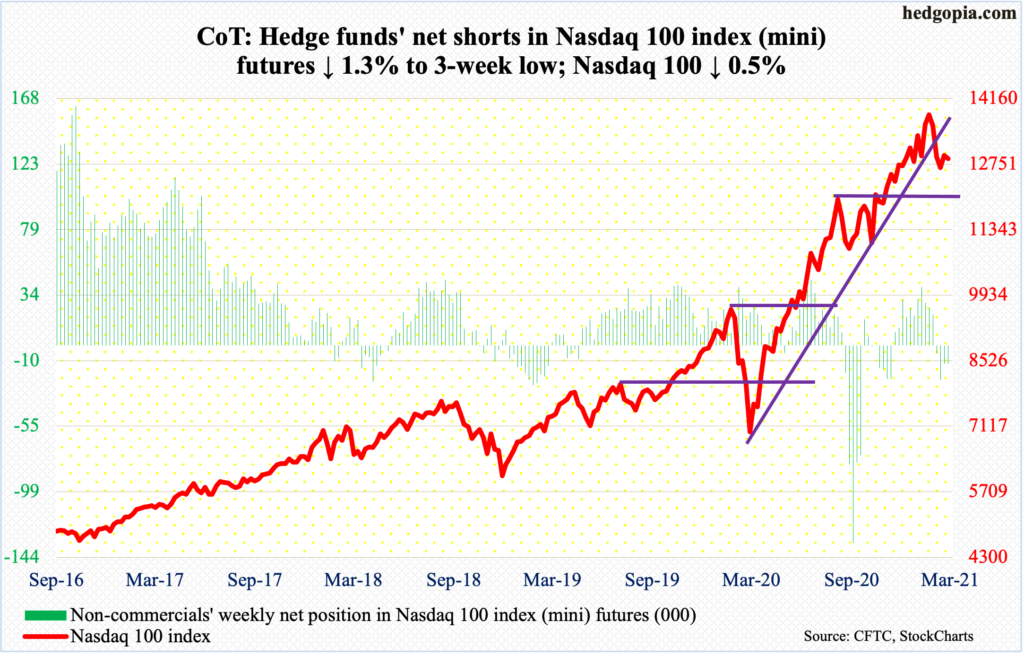
The Nasdaq 100 (12866.99) continues to act like a sick puppy. Bulls’ attempts to reclaim the 50-day on Tuesday and Wednesday met with more selling. In the end, the weekly produced a candle with a long upper shadow. This followed a monthly shooting star in February and a long-legged doji in January.
A rising trend line from last March’s low has already been breached. Early this month, the October high of 12200s (12430s in September) was defended. This likely gets tested again in the sessions ahead.
Russell 2000 mini-index: Currently net long 16.2k, up 11.5k.
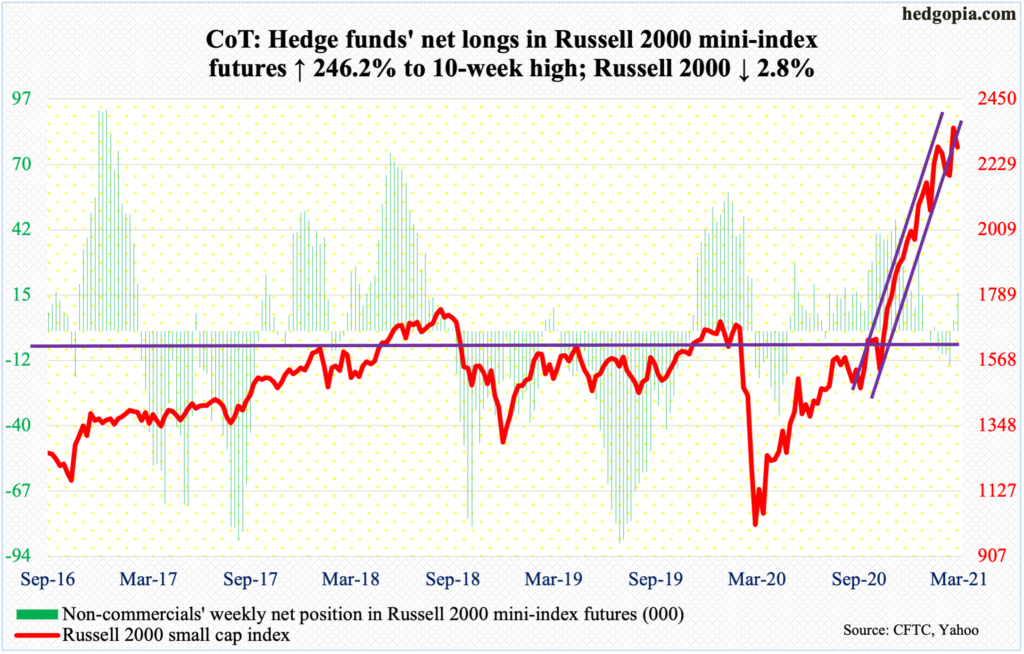
The Russell 2000 (2287.55) rallied to a new intraday high of 2360.17 on Monday but was unable to build on it in the subsequent sessions.
Ahead of this, the small cap index last week reclaimed an ascending channel from October-November last year, although just by a whisker. This week, sellers showed up at the underside of that essentially broken channel.
Nearest horizontal support lies at 2150s, and 2070s-2080s after that; the latter was defended early this month.
US Dollar Index: Currently net long 5.8k, up 14.7k.
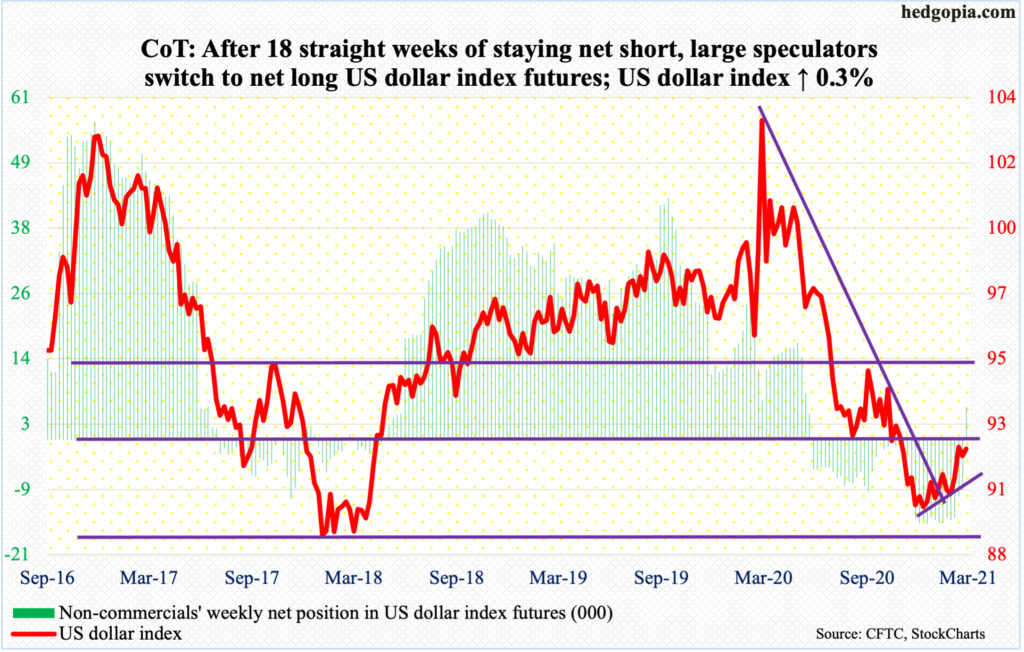
Once again, sellers showed up just north of 92 on Tuesday, Wednesday and Friday. There is major resistance at 92 – or just north of it – which was lost last November. On the 9th, the US dollar index (91.93) rallied as high as 92.53 intraday and that was about it.
That said, dollar bulls can take solace in the fact that since the index bottomed at 89.17 on January 6 it has printed higher lows, and higher highs as well. Momentum will have decisively shifted upward should the March 9th high get taken out.
For now, it is possible the daily heads lower, with trend-line support from January at 90.40. The 50-day lies at 90.84.
Perhaps importantly, non-commercials are now net long. This comes after 18 consecutive weeks of being net short.
VIX: Currently net short 114.6k, down 15.8k.
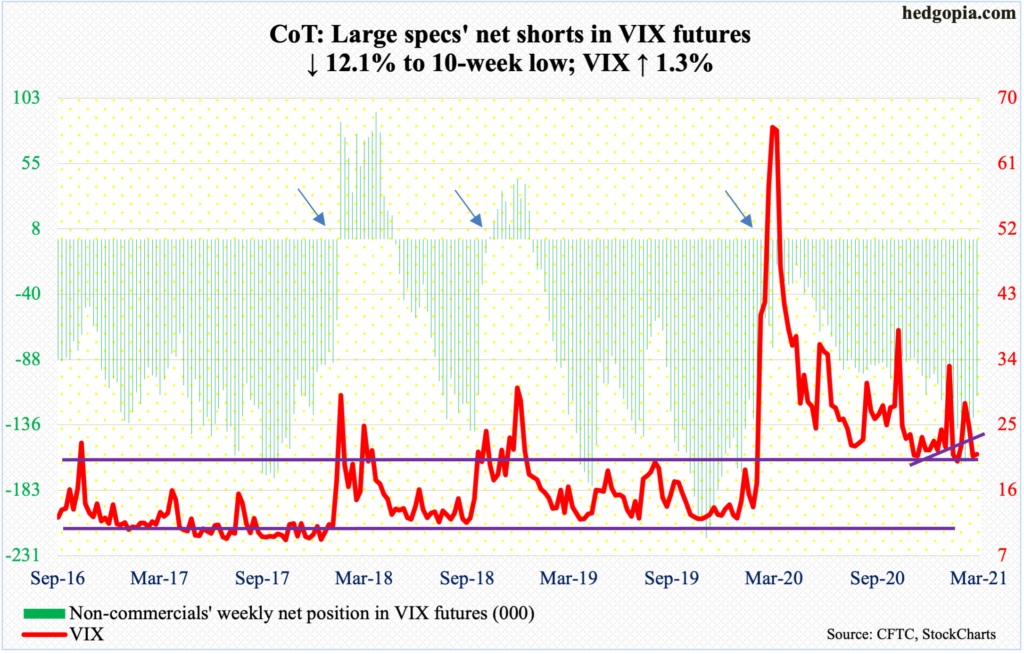
Equity bulls had some opening this week to push volatility lower but were unable to make the most of it.
On Thursday, VIX (20.95) went sub-19 (18.95, to be precise) before it rallied to end the session up 2.35 points to 21.58; in the end, the weekly ended with a spinning top. Thursday’s was the lowest print since last February – just before VIX went parabolic to peak at 85.47 in March. Since then, the index has consistently made lower highs – the latest being 31.90 on the 4th this month. Before volatility bulls can think of a higher high, they have to first reclaim mid-20s, which approximate the 200-day at 25.76. The 50-day rests at 23.58.
Thanks for reading!
