
Following futures positions of non-commercials are as of October 12, 2021.
10-year note: Currently net long 156k, up 14.7k.
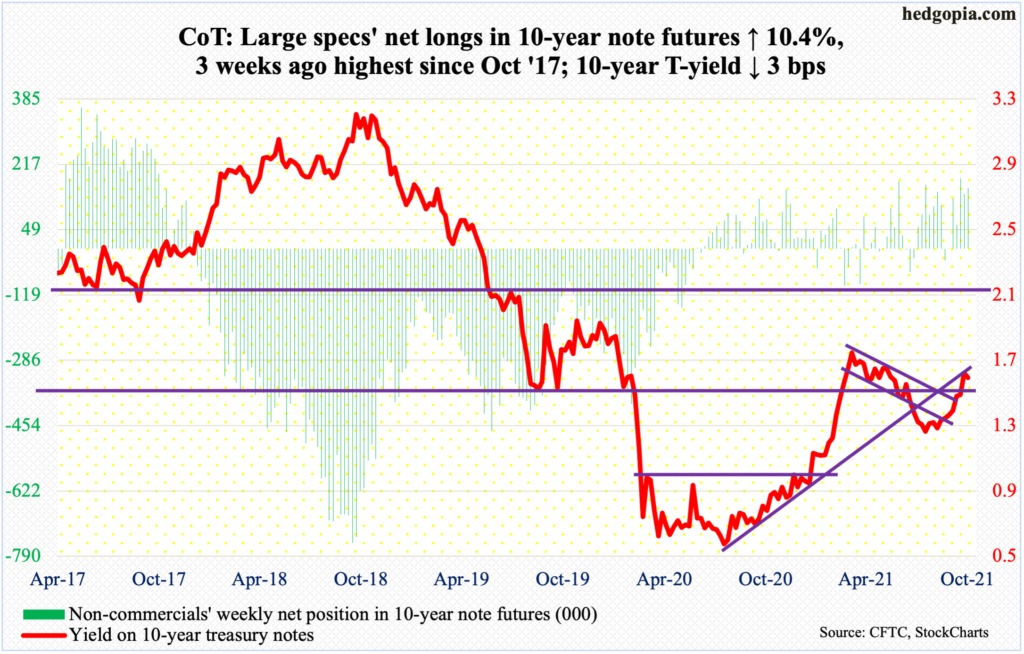
Last Friday’s high of 1.62 percent on the 10-year treasury yield represents a lower high versus 1.77 percent posted in March this year, which was the highest since January last year. The March high has the potential to be an important high.
The Fed is under intense pressure to begin tapering. At the September 21-22 FOMC meeting, Chair Jerome Powell set the stage for a tapering announcement in November.
Currently, the Fed buys up to $120 billion a month in treasury notes and bonds ($80 billion) and in mortgage-backed securities ($40 billion). It intends to end the program around the second half of next year. The balance sheet has doubled from $4.24 trillion in early March last year to $8.48 trillion. There were also hints that rates may rise sooner than expected. The fed funds rate is currently zero-bound.
Tapering is around the corner. It is a foregone conclusion. The question is that of speed. Pressure is building on the central bank to taper with aggression. Fed officials themselves are now questioning the wisdom of calling the current spike on consumer inflation as transitory (more on this here). In the 12 months to September, core CPI rose four percent, versus a 1.28 percent pace in February (chart here).
Going by how the prior three iterations of quantitative easing evolved, the 10-year yield (1.58 percent) tends to drop and bottom around the time QE begins and peak midway through the program. If this holds true this time, the March high in rates can act as a good reference point.
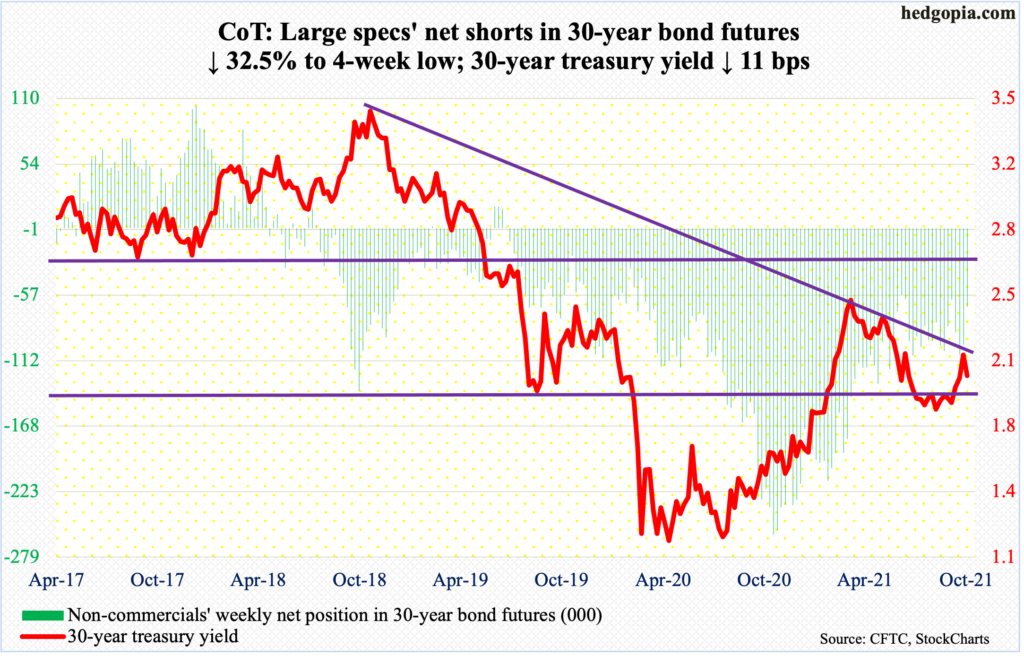
30-year bond: Currently net short 66.6k, down 32.1k.
Major economic releases for next week are as follows.
Industrial production (September), the NAHB Housing Market Index (October) and Treasury International Capital data (August) will be out on Monday.
Capacity utilization increased 0.4 percent month-over-month in August to 76.4 percent – a 20-month high.
In the 12 months to July, foreigners’ purchases of US stocks totaled $261.7 billion, which is a healthy sum yet lower than the record $405.5 billion from March this year.
Homebuilder confidence edged up a point m/m in September to 76. The all-time high of 90 was posted last November, which was triple the post-pandemic low of 30 from April last year.
Housing starts (September) are due out on Tuesday. Starts rose 3.9 percent m/m in August to a seasonally adjusted annual rate of 1.6 million units.
Existing home sales (September) will be published on Thursday. August sales declined two percent m/m to 5.9 million units (SAAR).
WTI crude oil: Currently net long 417.4k, up 21.1k.
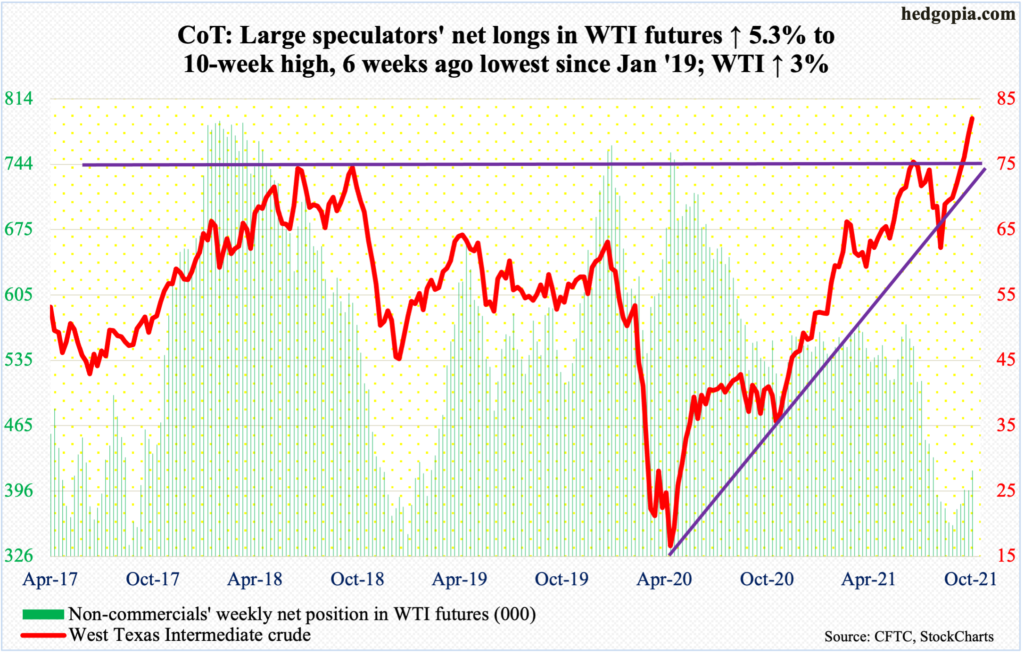
Oil bulls kept pressing higher with Monday’s shooting star session ticking $82.18. This was followed by a spinning top on both Tuesday and Wednesday. These are indecision/potentially reversal candles and have appeared amidst a trend that is still very strong. For the week, the crude rallied three percent – 8th straight positive week.
On Monday last week, WTI ($81.73/barrel) broke out of horizontal resistance at $77, or just under, immediately followed by a successful retest of the breakout, or $74-$75. Conditions are overbought – on nearly all timeframe – but the upward momentum is yet to break. It is bulls’ ball to lose.
In the meantime, US crude production in the week to October 8 increased 100,000 barrels per day to 11.4 million b/d. Crude stocks rose as well, up 6.1 million barrels to 427 million barrels. Crude imports went the other way, down one mb/d to six mb/d. As did stocks of gasoline and distillates, which were respectively down two million barrels and 24,000 barrels to 223.1 million barrels and 129.3 million barrels. Refinery utilization dropped 2.9 percentage points to 86.7 percent.
E-mini S&P 500: Currently net long 98.8k, up 26k.
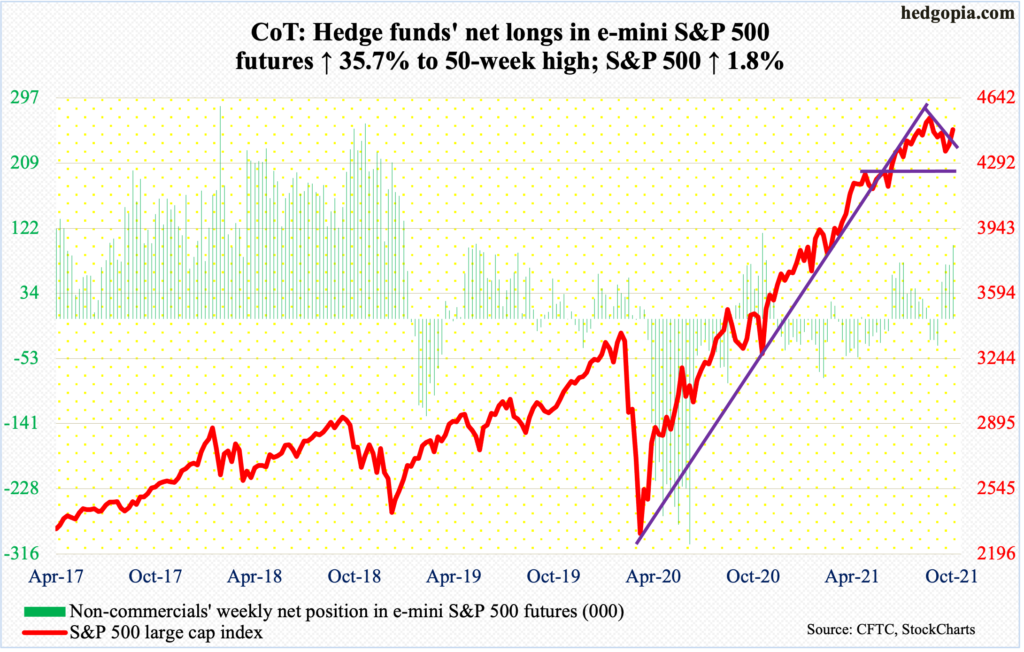
Since losing the 50-day on September 20, the S&P 500 tried to recapture the average twice, but unsuccessfully. Thursday’s 1.7-percent jump put the large cap index right on the average (4437). Thanks to Friday’s 33-point rally, it is now 0.8-percent past the average. Unlike the prior two occasions, the difference this time is that in Thursday’s gap-up, marubozu session the S&P 500 (4471) also broke out of a falling trend line from September 2 when it peaked at 4546.
Ahead, there is straight-line resistance at 4480s, which is within spitting distance, and after that lies the early-September record high.
The 3Q earnings season just got underway (more on this here). Bulls have the momentum. In the futures market, non-commercials are aggressively leaning bullish, with net longs at a 50-week high.
Euro: Currently net short 18.4k, down 3.9k.
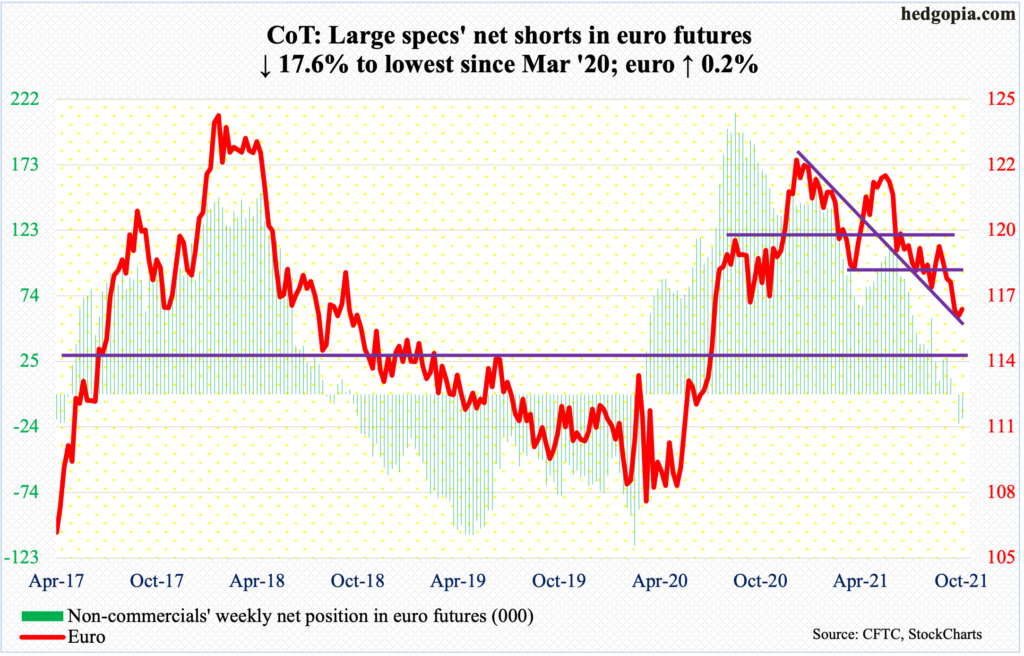
The euro ($1.16) made yet another low before giving out early signs of stability. Tuesday’s intraday low of $1.1525 undercut the gap-down low of $1.1533 from the 6th. Horizontal support just south of $1.15 goes back 18 years.
The currency has been caught in a downtrend since peaking at $1.2345 in January this year, followed by lower highs of $1.2267 in May and $1.1909 in August. On September 22, support just north of $1.17 was breached. The 50-day at $1.1717 lies around there. Should the euro stabilize around here and head higher, this is where a bull-bear duel is likely to ensue.
Gold: Currently net long 185.5k, up 3k.
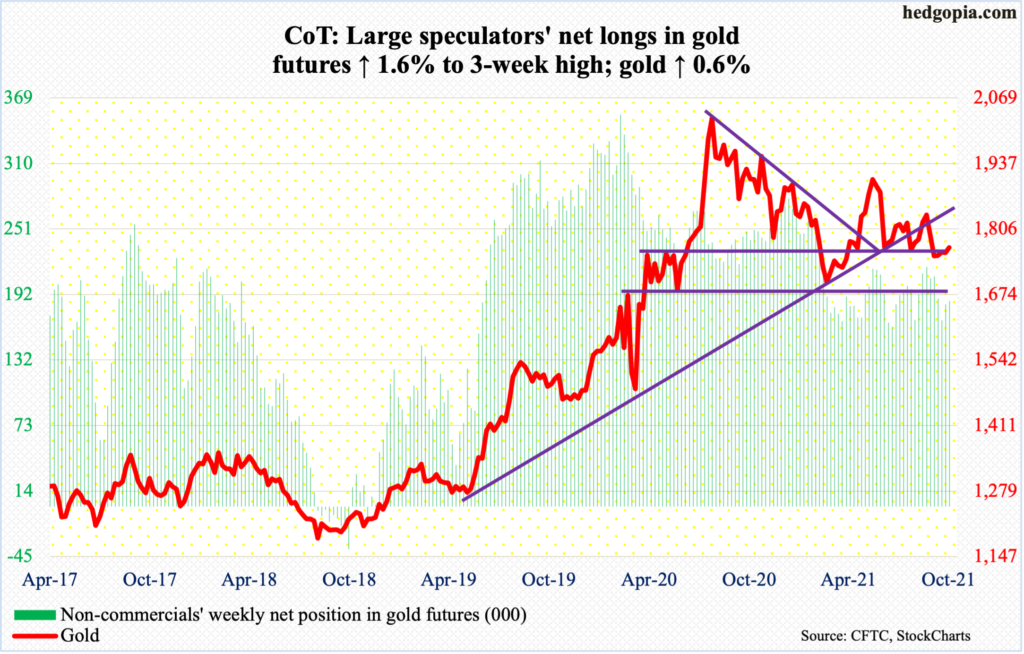
Gold ($1,768/ounce) reclaimed $1,760s-$1,770s this week, but only for a couple of sessions. This followed a drop at the end of September toward the lower Bollinger band at $1,720s. Friday’s reversal took place at the upper band.
Wednesday’s two-percent rally helped the metal push through the 50-day before testing the 200-day ($1,799). For three months now, the latter has proven to be tough to crack, with three unsuccessful attempts. This week’s fourth one met with the same fate.
Daily conditions were getting extended. Plus, around $1,830s lies trend-line resistance from August last year when the yellow metal peaked at record $2,089. On Thursday, gold ticked $1,802.
It is probable $1,760s-$1,770s once again gets breached in the sessions ahead. The daily lower Bollinger band lies at $1,728.
Nasdaq 100 index (mini): Currently net short 818, down 1.8k.
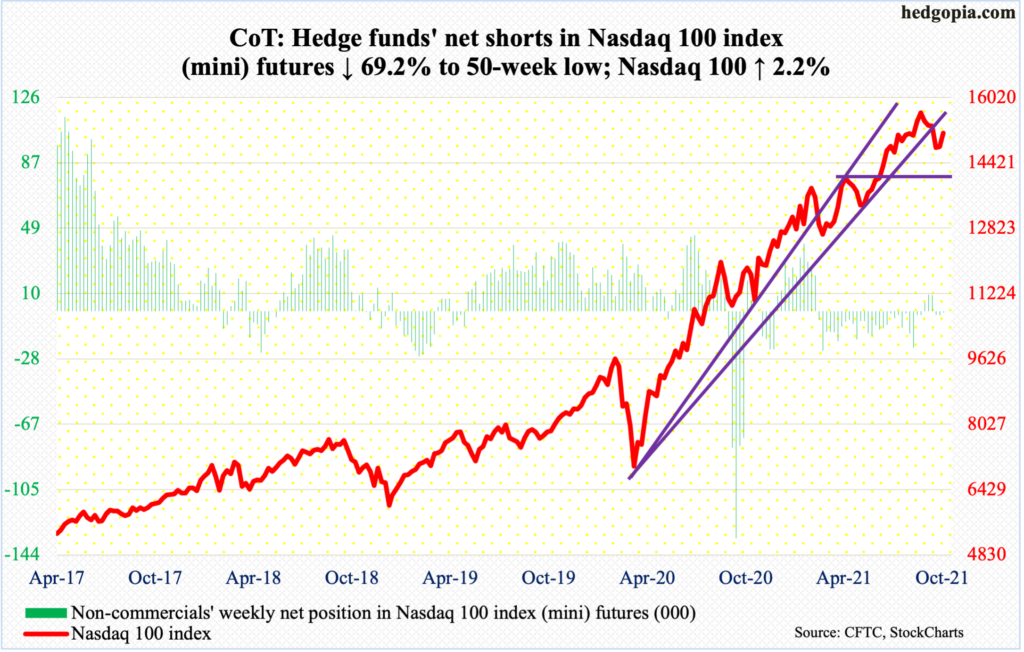
With the top five tech outfits, which are also the top five largest US companies, yet to report their September quarter, a crucial test lies ahead on the Nasdaq 100 (15147).
This week, the tech-heavy index rallied 2.2 percent – back-to-back positive week. It closed out the week right on the 50-day, which also lines up with horizontal resistance at 15100s. This will be an important test, on the way, bulls hope, to testing the record high of 15701 from September 7.
The top five – Apple (AAPL), Microsoft (MSFT), Amazon (AMZN), Google owner Alphabet (GOOG) and Facebook (FB) report the week after. Tesla (TSLA), the sixth largest, reports next Wednesday.
Russell 2000 mini-index: Currently net short 48.7k, down 9.9k.
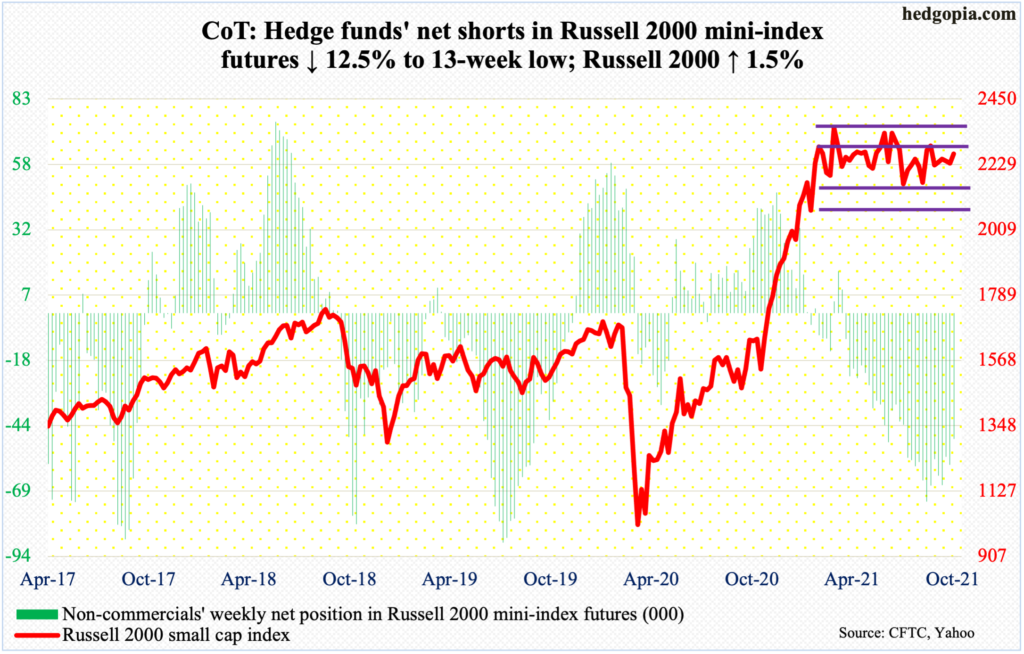
The Russell 2000 has been rangebound between 2350s and 2080s for seven months now. Within this rectangle lies another range between 2280s and 2150s. On Friday, the small cap index rallied as high as 2306 – 2.3 percent from record high posted in March this year – but only to reverse sharply lower to close at 2266. In essence, resistance at 2280s continues to act as a roadblock.
Non-commercials have been reducing their net shorts, and that is helping the bulls, but Friday’s action shows they are not too keen on holding their longs and are rather motivated by potential short squeeze.
US Dollar Index: Currently net long 35.1k, up 3k.
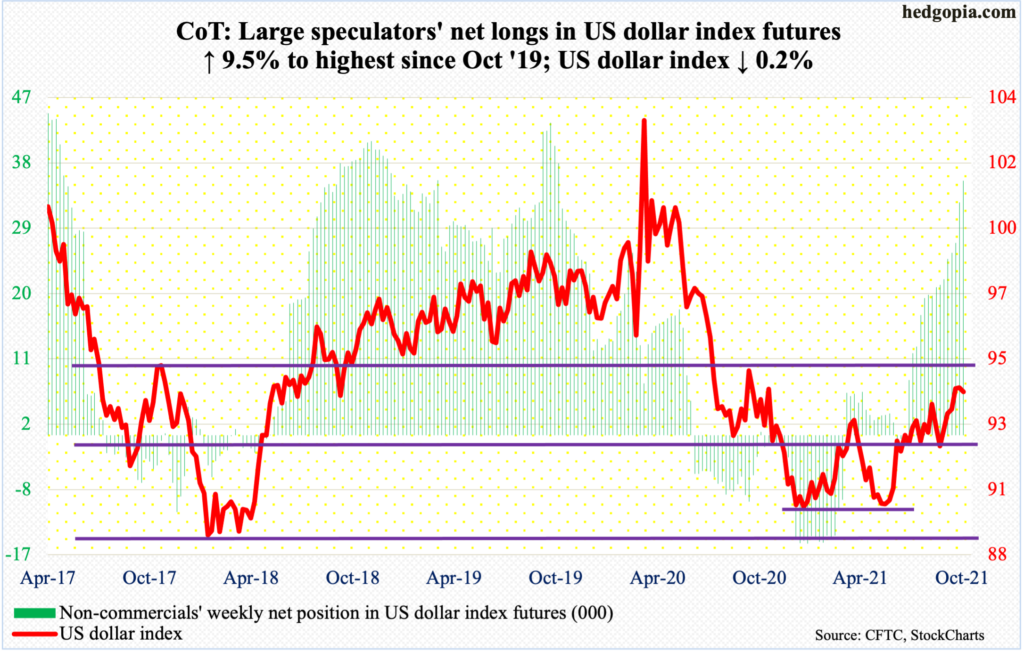
Three consecutive weeks of weekly candles with long upper shadows. Tuesday’s high of 94.57 surpassed the prior high from September 30 by 0.05 but bulls were unable to keep it.
On September 28, the US dollar index (93.94) broke out of 93.50s. A breakout retest probably lies ahead.
VIX: Currently net short 73.6k, up 4k.
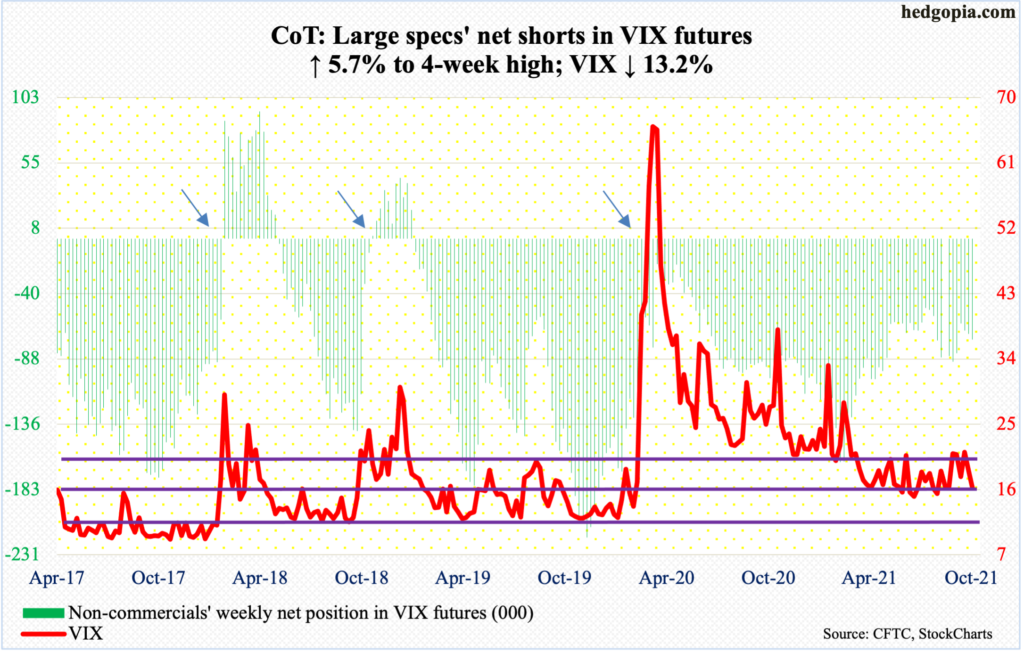
Thursday’s close of 16.86 landed right on rising trend-line support from June 29 when VIX bottomed at 14.10. on Friday, it gave way, with the volatility index dropping as low as 15.72 and closing at 16.30.
Last week, weekly RSI turned back down from 55. This week, it penetrated 50. Going back several years, it has routinely found support at low-40s, which also suggests waning momentum immediately ahead.
In this scenario, volatility likely weakens ahead.
Thanks for reading!
