
Following futures positions of non-commercials are as of December 7, 2021.
10-year note: Currently net short 267k, down 46.4k.
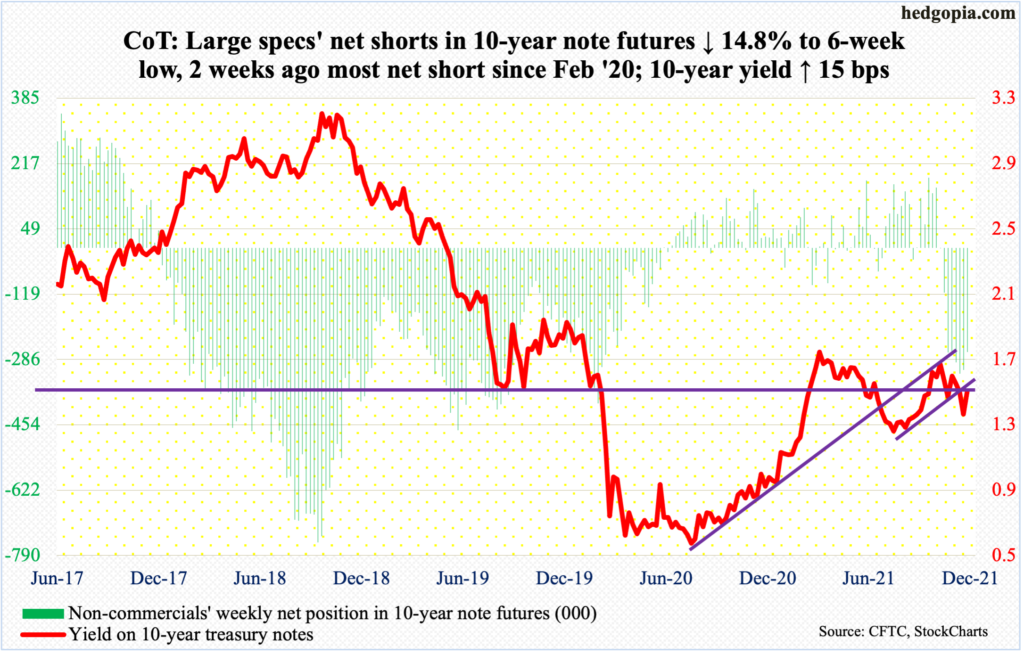
This year’s final FOMC meeting takes place next week. Last week, Jerome Powell, Fed chair, floated the idea of accelerated taper of bond purchases, which at the current pace of $15 billion a month is set to complete by the middle of next year. This by default also implies rate-hike plans will be brought forward.
Traditionally, the Fed tends to follow the markets’ lead. In the futures market, traders are currently anticipating up to three 25-basis-point hikes in the second half next year. The Fed is nowhere near that. Perhaps importantly, Powell last week stated that he would no longer use the word “transitory” to describe inflation, essentially saying inflation is persisting. If that is the case, next week will be the time for him to elaborate on that further – and likely on when tightening might begin.
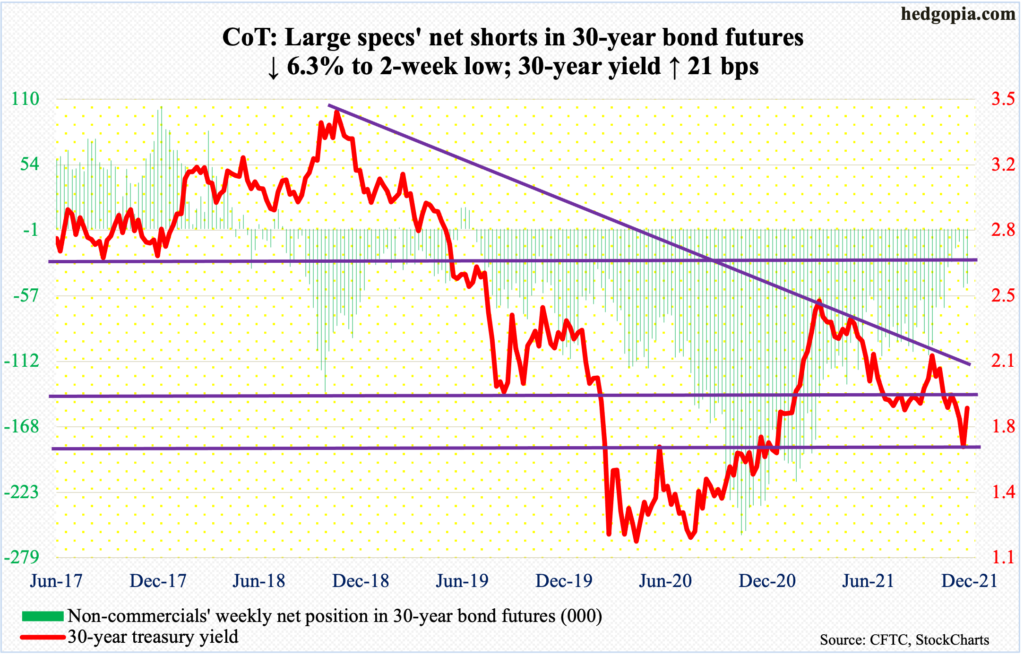
30-year bond: Currently net short 46.5k, down 3.1k.
Major economic releases for next week are as follows.
The NFIB optimism index (November) and the producer price index (November) will be out on Tuesday.
Small-business job openings slid a couple of points in October from September’s record 51. In May last year, the post-pandemic low of 23 was hit.
October wholesale prices increased 0.6 percent month-over-month and 8.6 percent year-over-year. Over the same duration, core producer prices rose 0.4 percent and 6.2 percent, in that order.
Retail sales (November), the NAHB housing market index (December) and Treasury International Capital (October) are scheduled for Wednesday.
Retail sales grew 1.7 percent m/m in October to a seasonally adjusted annual rate of $638.2 billion – a record. In April last year, sales reached a post-pandemic low of $409.8 billion.
Homebuilder optimism increased three points m/m in November to 83. A year ago, a record 90 was hit, which was three times the post-pandemic low of 30 reached in April last year.
In the 12 months to September, foreigners bought $194.7 billion in US stocks. This is a decent amount, except the trend is down, having peaked at record $405.5 billion in March.
Thursday brings housing starts (November) and industrial production (November).
Starts fell 0.7 percent m/m in October to 1.52 million units (SAAR), which was a six-month low. In March this year, starts peaked at 1.73 million.
Capacity utilization in October rose 1.6 percent m/m to 76.4 percent – a 22-month high.
WTI crude oil: Currently net long 395.3k, down 19.6k.
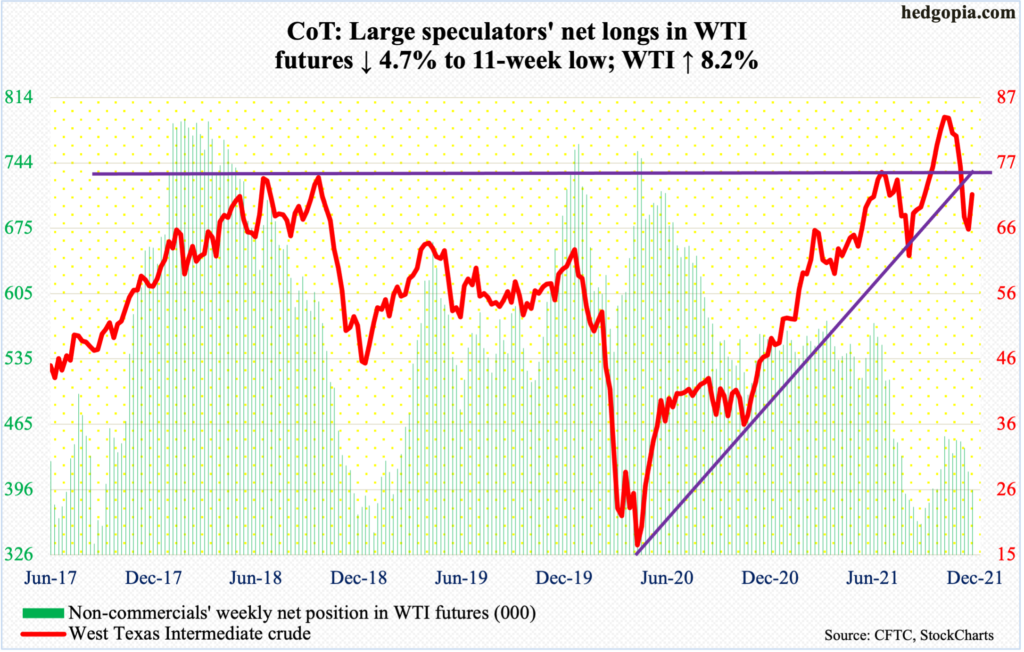
Last Thursday’s intraday low of $62.43 is holding. There is decent horizontal support at $62-$63. On Tuesday this week, WTI ($71.67/barrel) reclaimed the 200-day and closed out the week just above the average. On Thursday, the crude rose as high as $73.34 but reversed to close the session down two percent. For the week, it rallied 8.2 percent – first up week in seven.
Oil bulls are trying to put their foot down, but they are no longer riding an up momentum. Both this week and last, the highs of the week kissed and were rejected at the underneath of a broken rising trend line from April last year when WTI bottomed at $6.50. Above lies another layer of resistance at $74-$75, and $76-$77 after that.
After the low of seven sessions ago, the daily RSI rose but only to struggle just under 50. Unless the metric rallies past the median, oil bulls have their work cut out.
E-mini S&P 500: Currently net long 165.4k, down 14.3k.
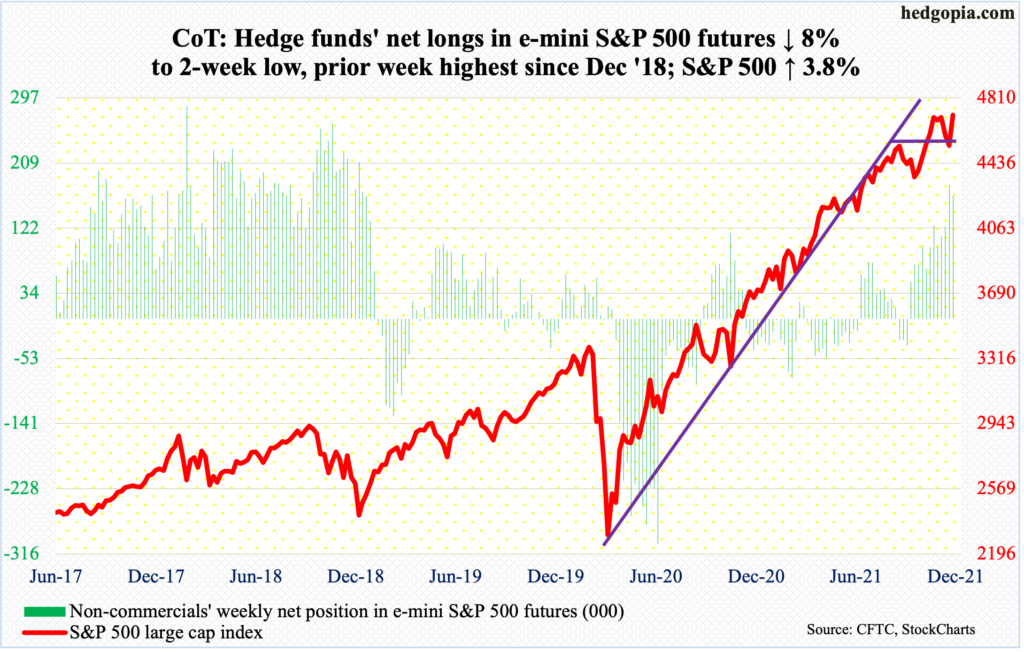
Once again, bulls used the 50-day to step up to the plate. From the November 22 record of 4744 through last Friday’s low of 4495, the S&P 500 quickly shed 5.2 percent. The large cap index ended last week just under the average. This week, it began to rally right from the word go. For well over a year now, the 50-day has consistently attracted bids.
For the week, the index (4712) rallied 3.8 percent and is merely 0.7 percent from its record high. Longs have faced resistance just north of 4700s for six weeks now. In a seasonally favorable period, a breakout is probably just a matter of time.
Money is coming in. In the week to Wednesday, SPY (SPDR S&P 500 ETF), VOO (Vanguard S&P 500 ETF) and IVV (iShares Core S&P 500 ETF) took in $7 billion (courtesy of ETF.com). In the same week, US-based stock funds lost $1.5 billion (courtesy of Lipper).
Euro: Currently net short 8.3k, down 14.9k.
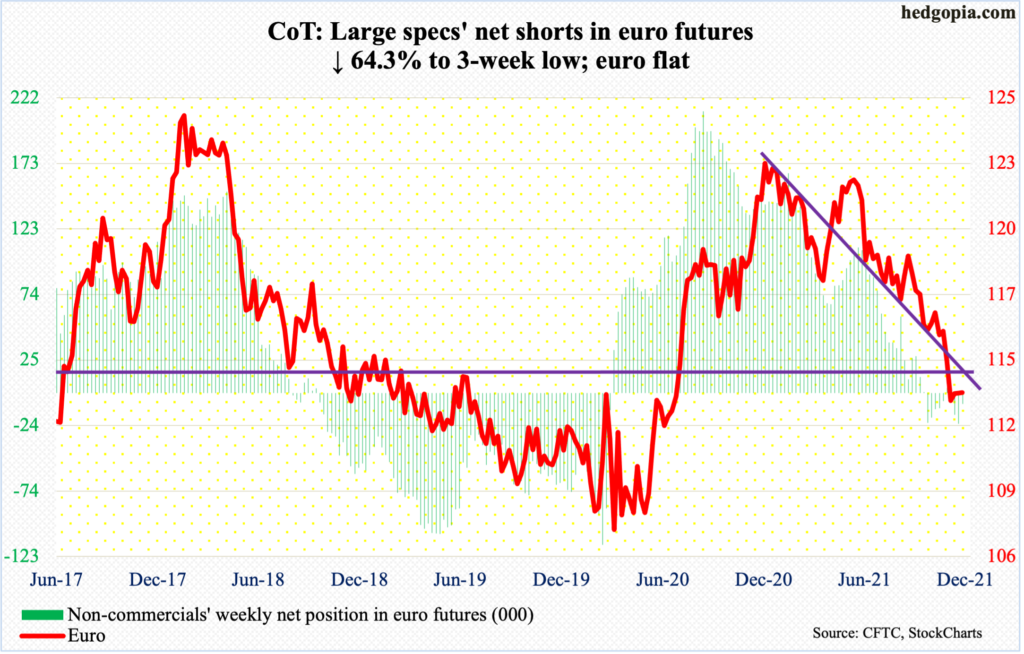
The euro ($1.1316) is working on a potentially bullish 10-and-20-day crossover. In a spinning top session on November 24, it touched $1.1187, which represented a weekly hammer low. Earlier in January (this year), the currency peaked at $1.2345.
The weekly hammer three weeks ago was followed by spinning tops in the subsequent couple of weeks.
There is resistance at $1.14-$1.15, which goes back at least 18 years. This is the one to watch for now.
Gold: Currently net long 217.2k, down 8.7k.
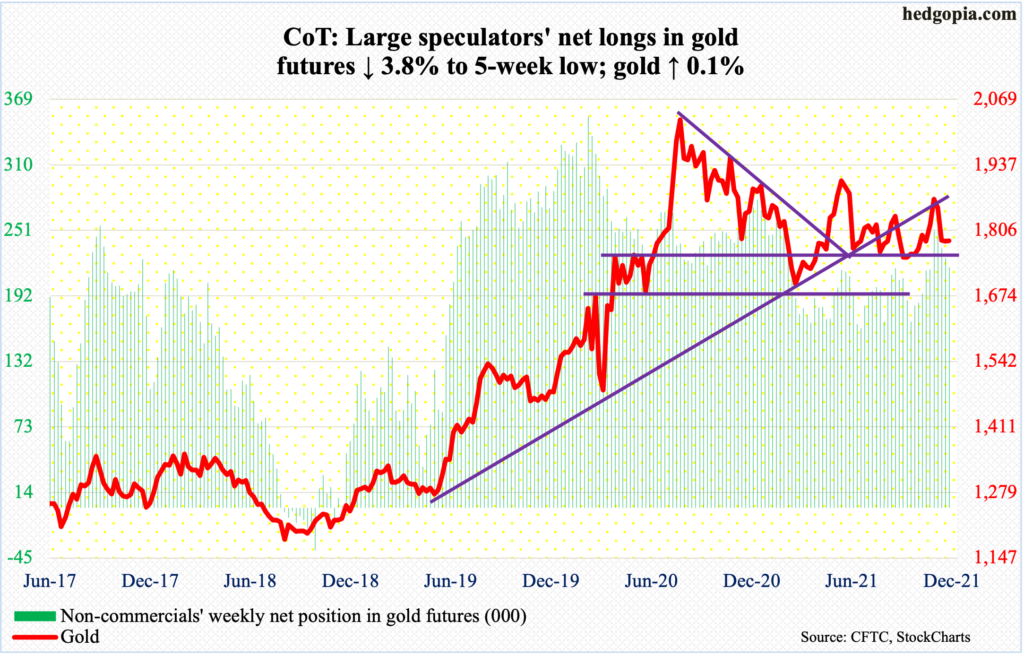
Gold ($1,785/ounce) has traded around its 50-and 200-day since November 23. The averages ($1,796 and $1,792 respectively) last week completed a golden cross, which can be bullish. This week, the metal traded just beneath the averages all week. Right around the averages also lie a rising trend line from August 9 when gold bottomed at $1,670s; it currently sits right on the trend line.
The yellow metal remains oversold on the daily. It is also above horizontal support at $1,760s-$1,770s. Gold bugs can remain hopeful so long as the metal is above this level.
Nasdaq 100 index (mini): Currently net long 25.8k, down 8.2k.
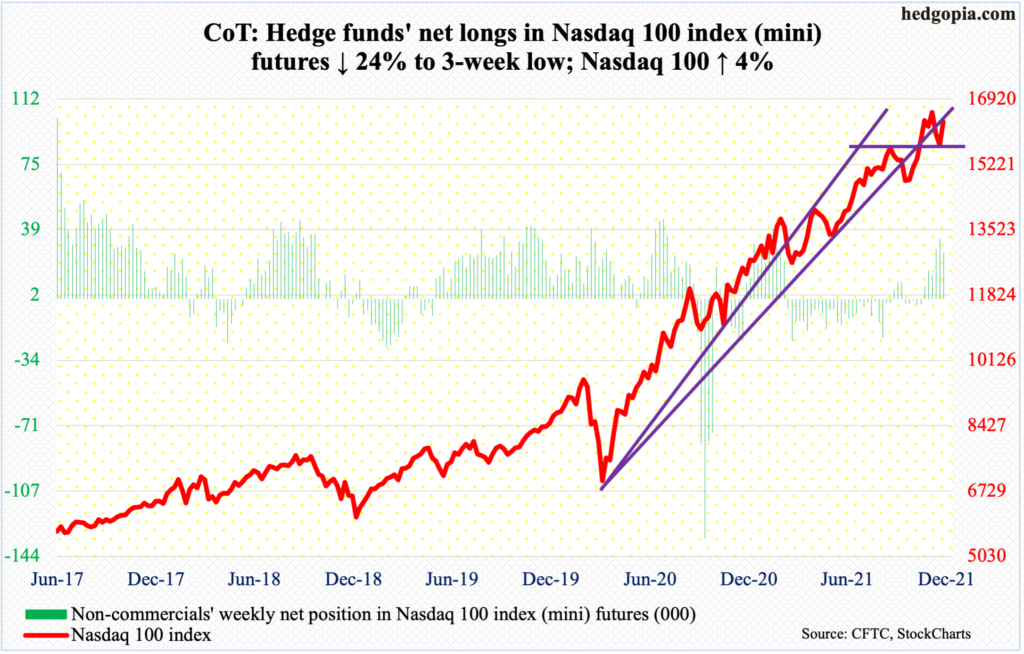
Last Friday as well as this Monday, the Nasdaq 100 traded under the 50-day intraday but only to finish above the average. This also meant straight-line support at 15700s was breached slightly but saved on time. Through last Friday’s low, the tech-heavy index dropped 7.3 percent from its November 22 high of 16765. It then proceeded to quickly rally 5.6 percent through Thursday’s high of 16413.
The index (16332) currently sits at an important juncture. Things are unlikely to evolve this way at least near term, but should weakness develop, it could very well be in the process of forming the right shoulder of a head-and-shoulders pattern, with the neckline at 16000. Should a breakdown occur, the pattern would ask for a drop toward 15100-15200.
Russell 2000 mini-index: Currently net short 27k, down 4.1k.
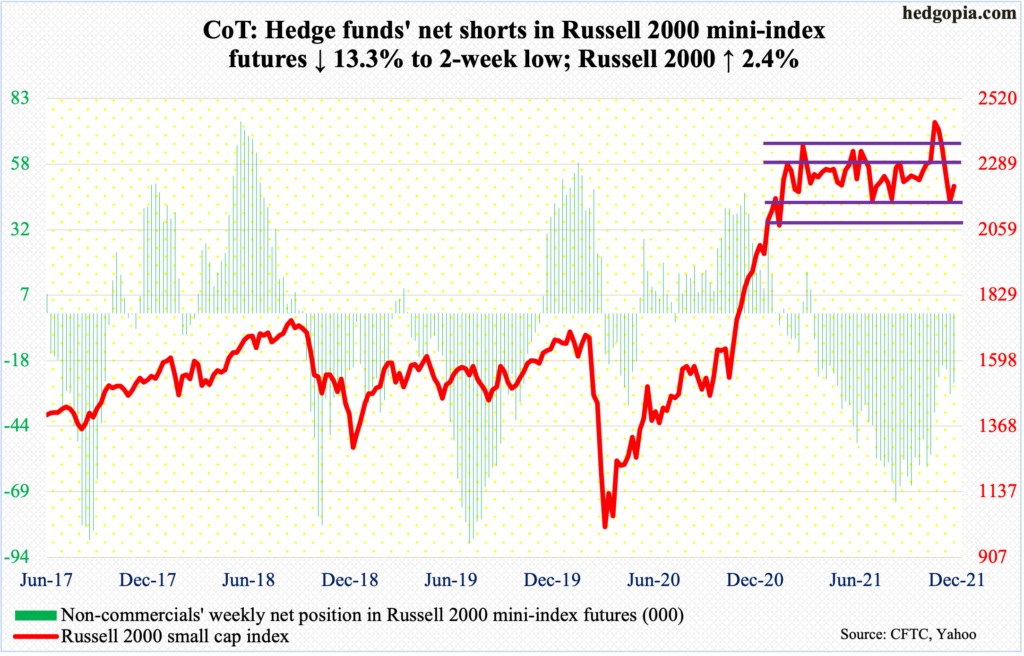
For nearly nine months now, the Russell 2000 has been rangebound between 2350s and 2080s, and between 2280s and 2150s within this rectangle. On Nov 3, the small cap index broke out, followed by a failed retest on the 19th.
Last week, the index closed at 2150s (more on this here). Come Monday (this week), small-cap bulls showed up right there before rallying the index two percent, and by another 2.3 percent and 0.8 percent on Tuesday and Wednesday. By Wednesday, it hit 2277, testing 2280s resistance. Sellers showed up there. The index closed out the week at 2212.
So, in essence, the Russell 2000 remains rangebound. For a while now, it has been profitable to sell the upper range and buy the lower.
Interestingly, non-commercials over the past three and a half months have massively reduced their bearish exposure. But small-cap bulls were unable to cash in on this, as the cash is essentially flat over the period.
US Dollar Index: Currently net long 34.9k, down 1k.
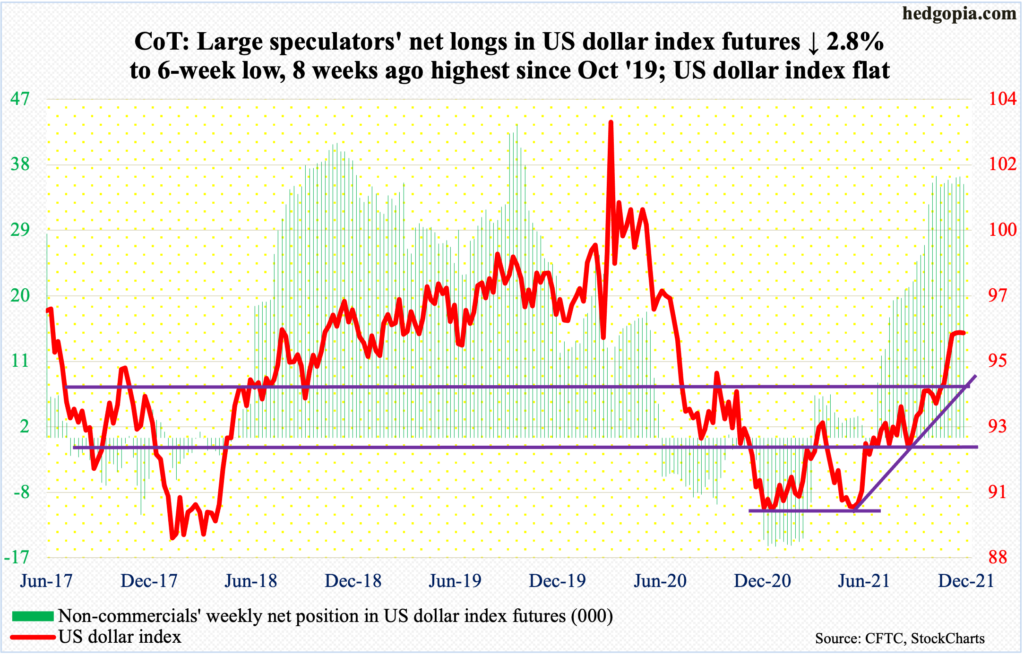
One more week and one more indecision candle on the US dollar index (96.10), which has been flat the last four weeks. This week, a spinning top showed up on the weekly. This was preceded by a spinning top last week and a gravestone doji the week before that.
On May 25 (this year), the index tagged 89.51 to successfully test 88-89 horizontal support. By November 24, it printed 96.94 before coming under pressure. Horizontal resistance around 97 goes back at least 18 years.
Nearest decent support lies at 94.50s, which is a confluence of multi-year straight line and rising trend line from May.
VIX: Currently net short 47.4k, down 13.8k.
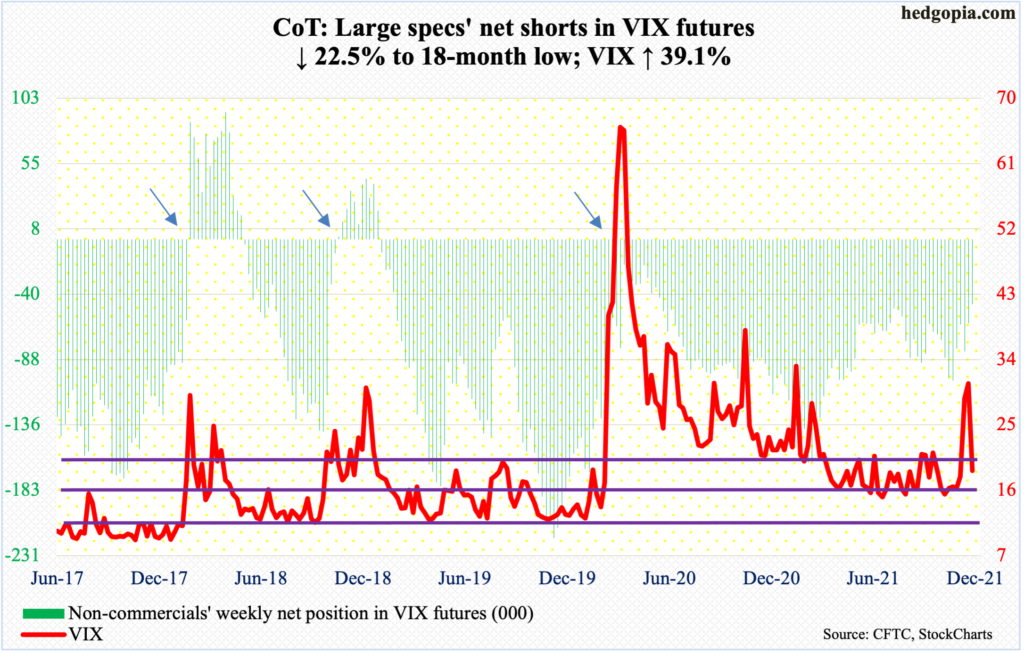
VIX underwent a spike reversal last week, having jumped as high as 35.32 intraday Friday but closed at 30.67 (more on this here). In the past, candles with similar shapes developed just before the volatility index came under sustained pressure. This week, VIX closed at 18.69, just a tad under the 200-day at 18.85 and right on a rising trend line from November 4. A breach, which is looking likely, raises the odds VIX drops toward 15 in the sessions ahead.
Thanks for reading!
