
Following futures positions of non-commercials are as of March 15, 2022.
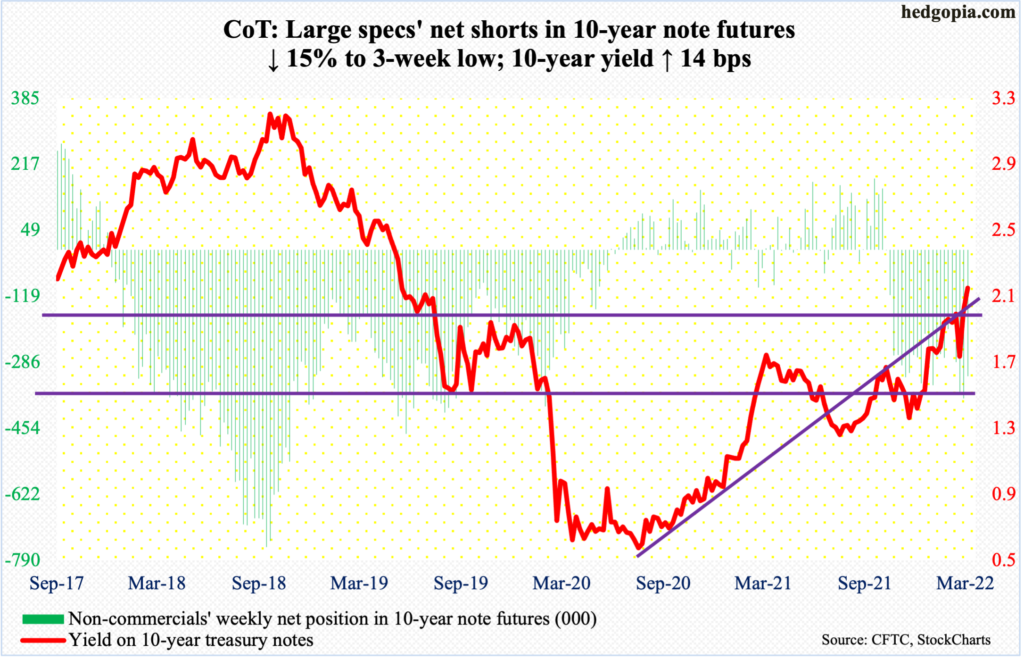
10-year note: Currently net short 321k, down 56.7k.
The Federal Reserve kicked off its rate hiking cycle this week by pushing up the fed funds rate by 25 basis points to a range of 25 basis points to 50 basis points. This was the first increase in the benchmark rate since December 2018. The dot plot signals six more hikes this year – essentially one each in the remaining six scheduled meetings.
They convene next on May 3-4. During that meeting, the Fed also plans to announce a plan to shrink its pool of assets, which has ballooned from already-elevated $4.24 trillion in early March 2020 to $8.95 trillion. So, it is going to be a double whammy – higher rates and reduced balance sheet.
The language – both the FOMC statement and Chair Jerome Powell’s post-meeting press conference – was unmistakably hawkish, although this probably would not be enough to reign in inflation. Powell may very well have to channel Paul Volcker at some point and that will be a big test.
Inflation is rampant, and the Fed recognizes it. Powell told the press on Wednesday that we may see high inflation through the middle of the year before it starts to come down. In the 12 months to February, the consumer price index jumped 7.9 percent, which was the steepest pace since January 1982; in May 2020, prices were barely rising, at 0.1 percent.
Interesting times lie ahead.
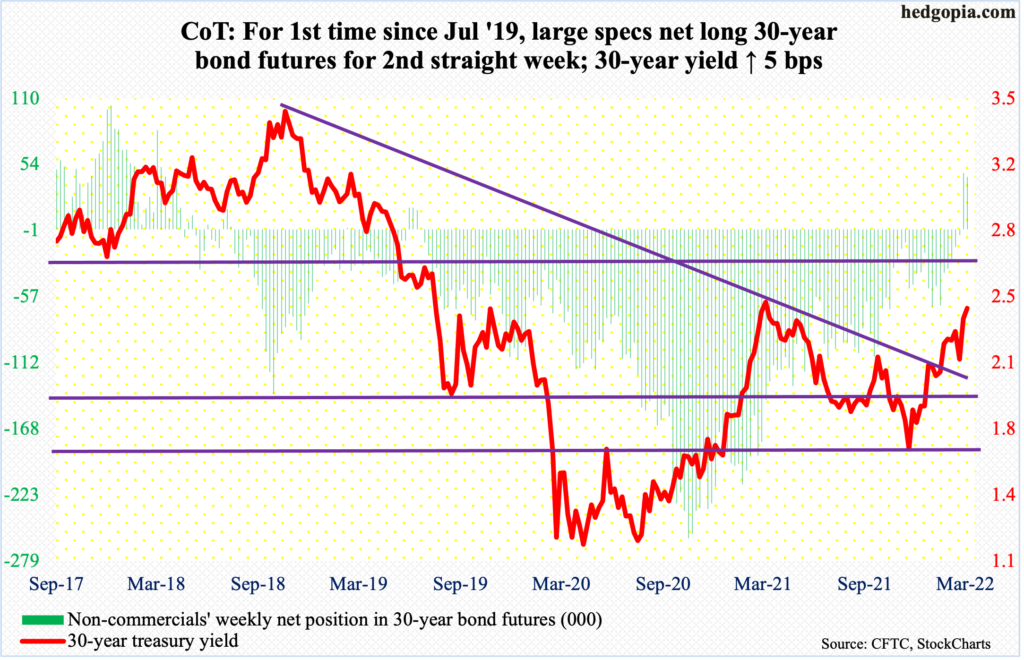
30-year bond: Currently net long 44.2k, down 3.1k.
Major economic releases for next week are as follows.
New home sales (February) are due out Wednesday. January sales were down 4.5 percent month-over-month to a seasonally adjusted annual rate of 801,000 units – a two-month low.
Durable goods orders (February) are scheduled for Thursday. Orders for non-defense capital goods ex-aircraft – proxy for business plans for capital expenditures – increased one percent m/m in January to $80.1 billion (SAAR). This is a new record.
Friday brings the University of Michigan’s consumer sentiment index (March, final). Preliminarily, sentiment dropped 3.1 points m/m in March to 59.7, which is the lowest since September 2011.
WTI crude oil: Currently net long 358.4k, up 7.7k.
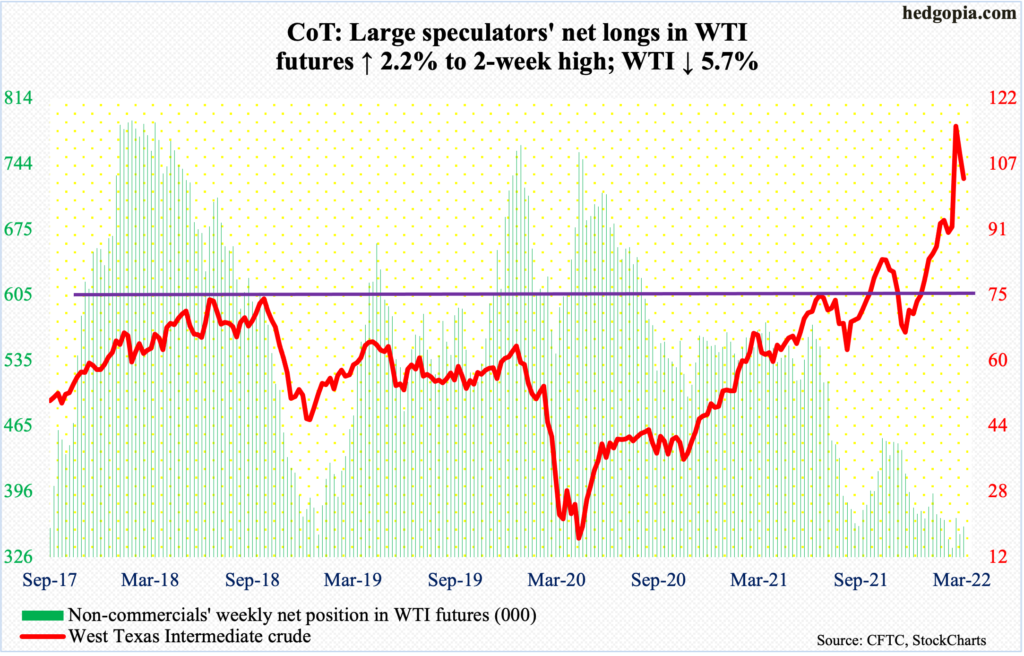
Between the December 2 (last year) low and the March 7 high intraday, WTI ($103.09/barrel) surged 109 percent, to $130.50. From that high through Thursday’s low, the crude quickly shed 28.4 percent; the session low of $93.41 was posted just above the 50-day. It has not been below the average since late December.
The daily is oversold. There is resistance at $105-$106. Longer-term – on the monthly in particular – there is a ways to go before the crude unwinds its overbought condition.
In the meantime, for the sixth straight week through the 11th, US crude production remained unchanged at 11.6 million barrels per day. Crude imports rose 76,000 b/d to 6.4 mb/d. Stocks of crude and distillates, too, rose – up 4.3 million barrels and 332,000 barrels respectively to 415.9 million barrels and 114.2 million barrels. Refinery utilization increased 1.1 percentage points to 90.4 percent.
E-mini S&P 500: Currently net long 102.2k, down 25.5k.
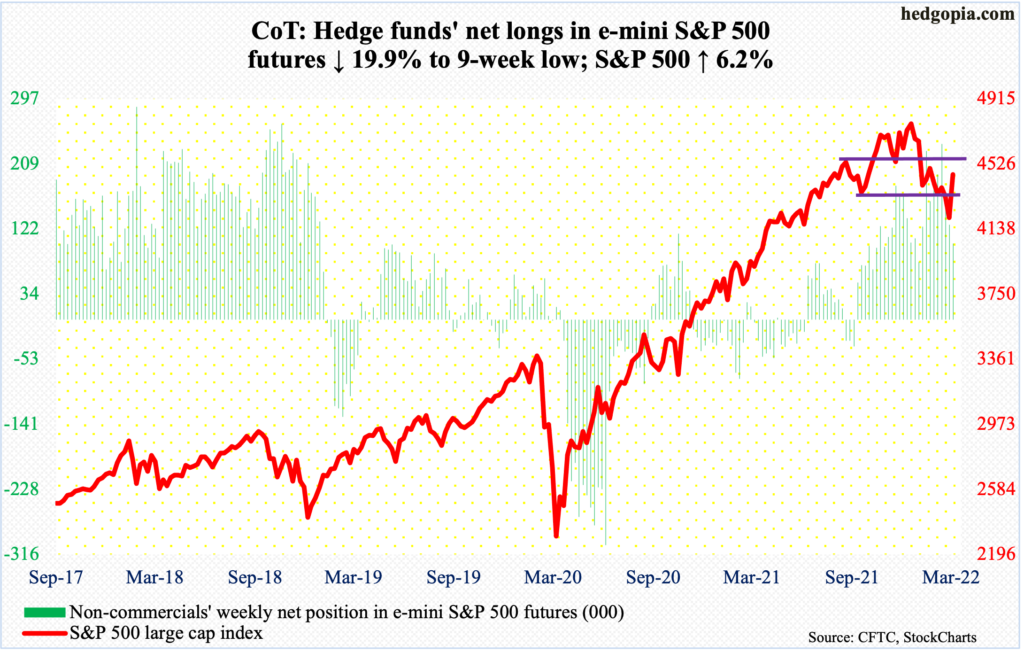
Through the February 24 low of 4115 from its record high of 4819 posted on January 4, the S&P 500 declined 14.6 percent. A rising trend line from that low was tested on Monday – successfully. This was then followed by a vicious rally. For the week, the S&P 500 (4463) jumped 6.2 percent.
The 200-day lies right above at 4470. Then, at 4550 lies 61.8-percent Fibonacci retracement of the January 4-February 24 drop.
Investor sentiment had taken a good hit in recent weeks, and that is helping stocks. As of Tuesday, the Investors Intelligence bulls-to-bears ratio remained sub-one for three straight weeks (more on this here). Record buybacks continue to provide a tailwind, although company boards going forward will probably rethink this strategy now that the Fed has embarked on a tightening cycle. Margin debt and foreigners’ buying are already acting as headwinds.
At some point, shorts are likely to again look for opportunities, particularly if the index reaches the aforementioned Fibonacci resistance.
Euro: Currently net long 18.8k, down 40k.
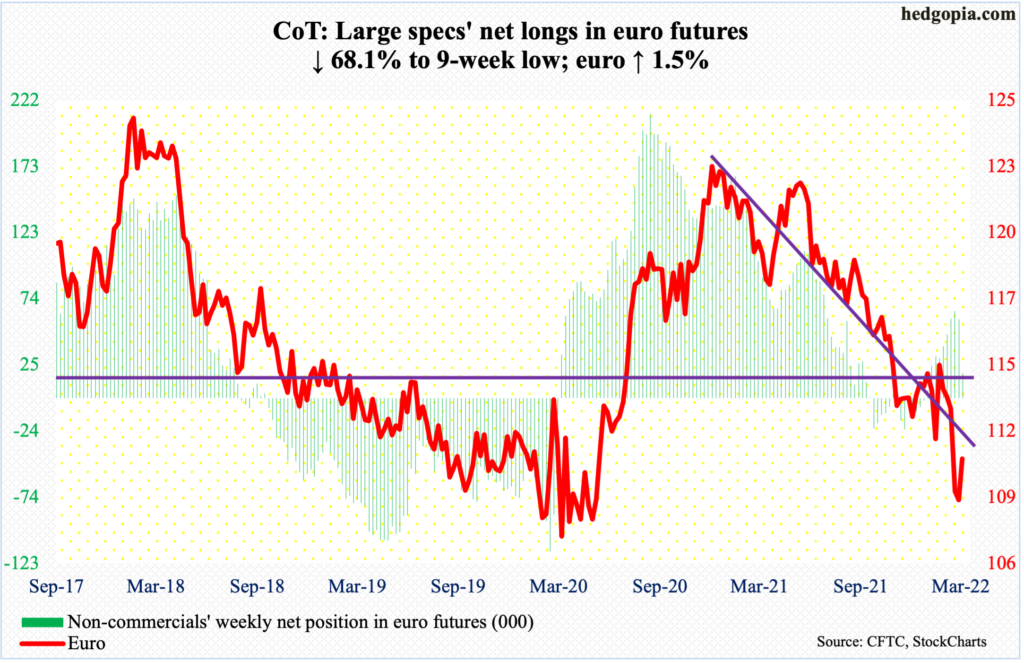
With nine sessions to go, March so far has produced a bullish monthly hammer; the intraday low of $108.45 on the 7th was a successful test of a rising trend line from January 2017 when the euro ($110.68) bottomed at $103.41.
Since last week’s low, the euro has trended higher. This week, it rallied 1.5 percent. Thursday’s high of $111.39 attracted sellers; this was just below $111.50 where a falling trend line from last June lies. Then, just under $112 lies horizontal resistance. Momentum swings bulls’ way should this be taken out.
Gold: Currently net long 261.8k, down 12.6k.
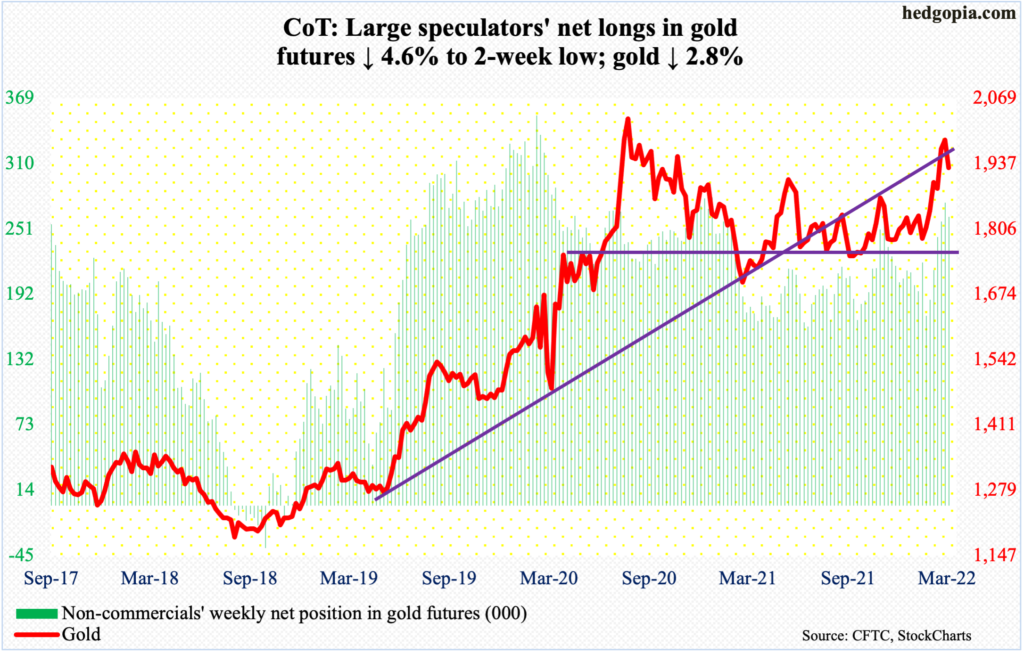
Once gold ($1,929/ounce) got rejected on the 8th less than $11 short of the August 2020 all-time high of $2,089, it melted quickly. In the next six sessions through Wednesday this week, the metal was down to $1,895.
In September 2011, gold retreated after touching $1,924. Subsequently, the yellow metal did not bottom until December 2015 when it tagged $1,045. The September 2011 high was surpassed in July 2020. There is thus a lot of memory attached to $1,920s. Gold bugs were unable to defend the level on Wednesday, reclaimed it on Thursday and ended Friday right on it.
Above, there is resistance at $1,970s. Below, in the event $1,920s is breached, there is support at $1,870s, which is where the 50-day rests.
Non-commercials’ holdings are worth watching. They are sitting on loads of net longs, have done well of late and can get tempted to lock in gains.
Nasdaq 100 index (mini): Currently net long 19k, down 7.6k.
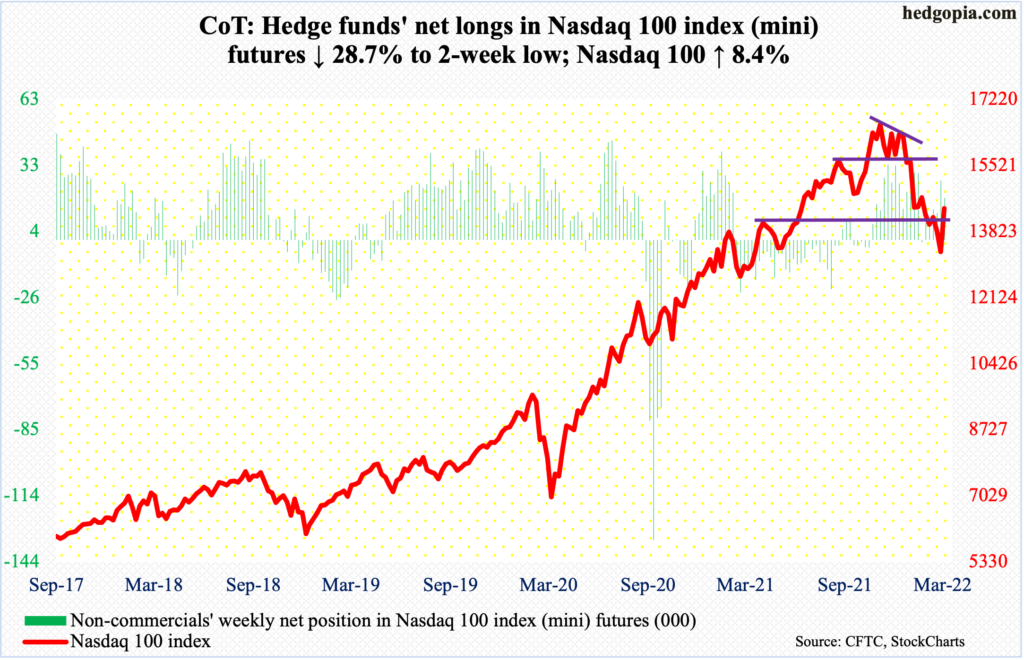
On Monday, the Nasdaq 100 (14420) tagged 13020 intraday to successfully test the February 24 low of 13065. The tech-heavy index then rallied strongly in the next four sessions, ending the week up 8.4 percent. Through this week’s low, it had earlier tumbled 22.3 percent from the record high of 16765 posted last November.
Even amidst this weakness, willingness to own tech was evident in the fact that the monthly candles for December, January and February all produced candles with long lower wicks. This is once again the case so far this month with a huge hammer reversal.
There is decent resistance at 14400s, which also approximates the 50-day at 14442. Shorts likely will try to defend these levels. If longs succeed in absorbing the distribution, there is a lot of room for the weekly to continue higher.
Russell 2000 mini-index: Currently net short 31.1k, up 5.6k.
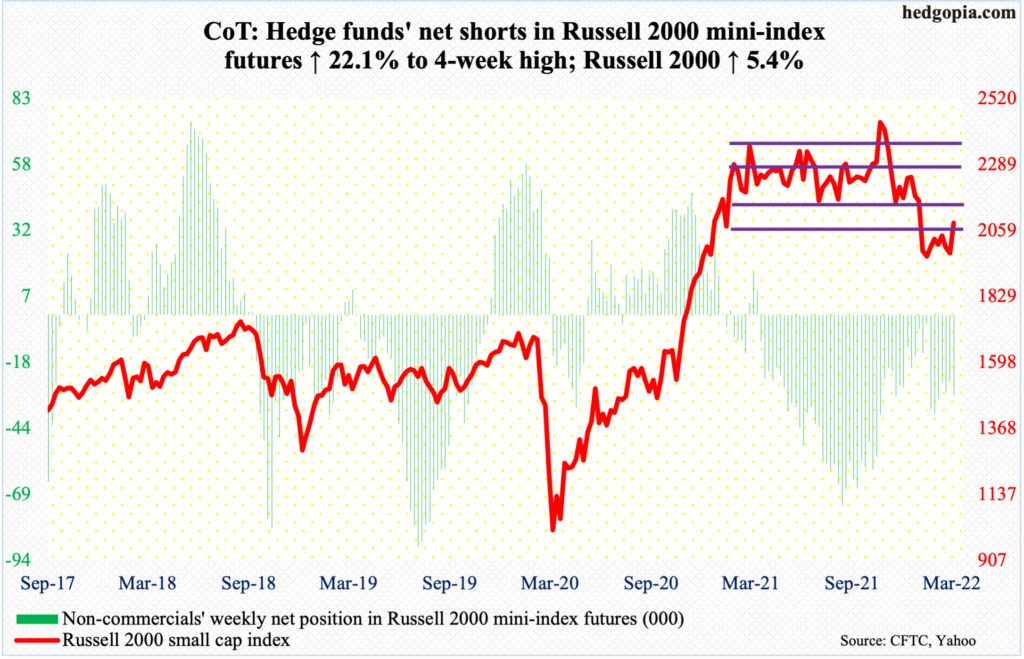
On Thursday, the Russell 2000 closed right underneath a falling trend line from the November 2021 all-time high of 2459. From that high through the February 24 low of 1895, the small cap index tumbled 23 percent. Come Friday, it poked its head out of the trend line, closing right on crucial resistance.
From last March through January, the Russell 2000 was rangebound between 2350s and 2080s, and between 2280s and 2150s within this rectangle. On Nov 3, it broke out but was quickly followed by a failed retest on the 19th (November), followed by a range breakdown in January.
For now, 2080s is a make-or-break. The index closed out the week at 2086.
US Dollar Index: Currently net long 28.4k, down 5.7k.
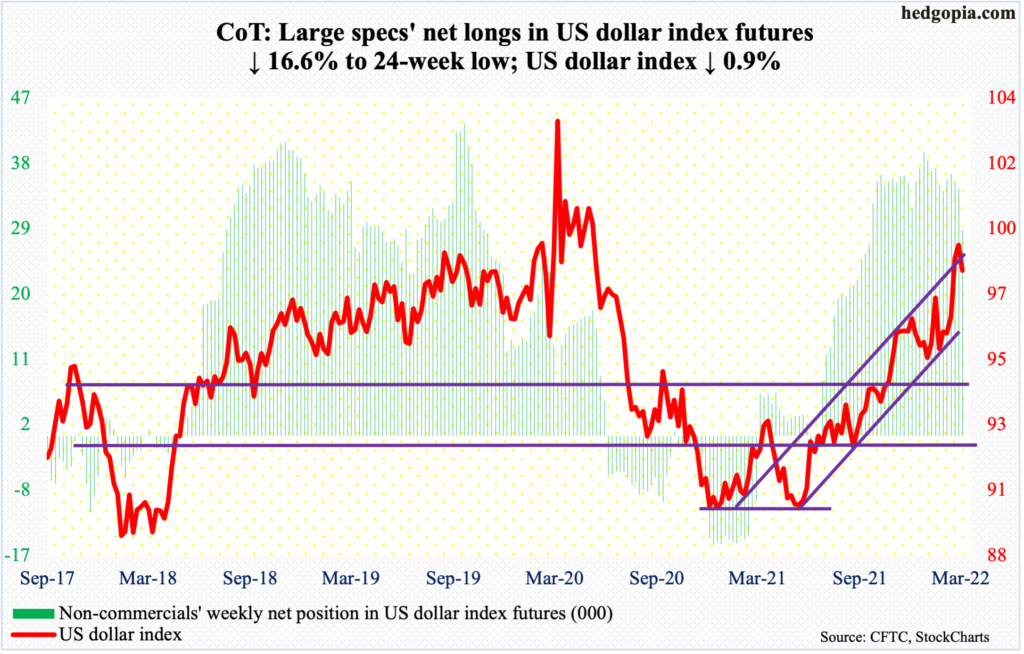
Dollar bulls once again went after the upper bound of an ascending channel, but to no avail; from last May, the US dollar index has trended higher after bottoming at 89.51. Last week, it ticked 99.42 intraday before weakening. Resistance at the 100 level goes back years. This week, it rose to 99.30 intraday Monday before coming under pressure.
Three weeks ago, the index decidedly broke out of 97. Both this week and last, low-97.70s attracted bids. From longs’ perspective, this is encouraging, but given how overbought the index is, this level should end up getting breached in due course. The 50-day lies at 96.65.
Non-commercials reduced holdings to a 24-week low and are still heavily net long.
VIX: Currently net short 47.9k, down 2.5k.
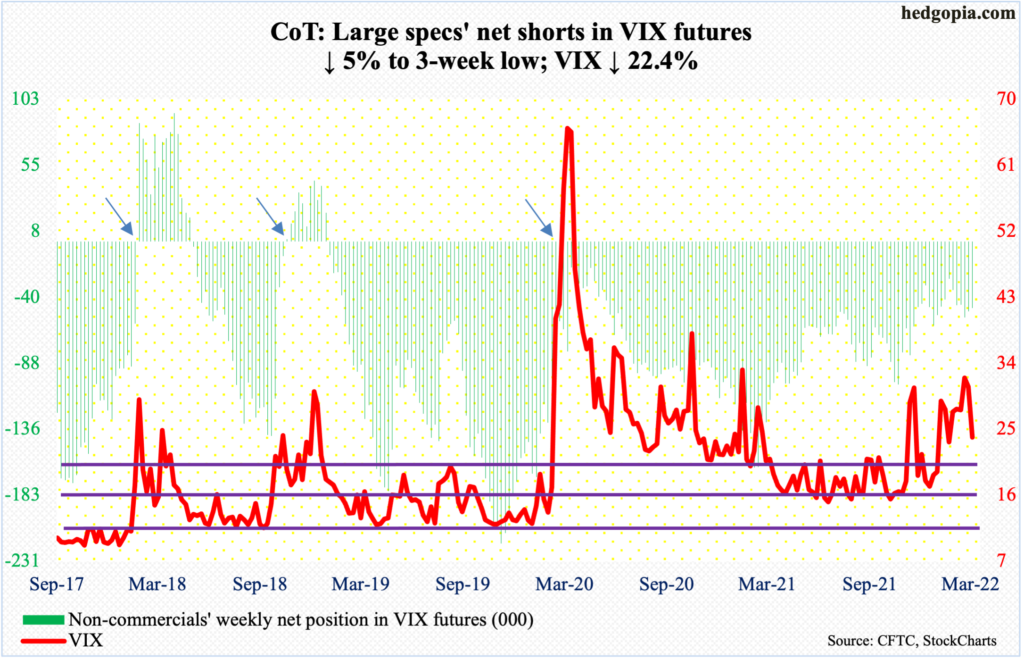
VIX (23.87) gave back 6.88 points this week, essentially ending the week at a rising trend line from early January. Should it give way, there is horizontal support at low-20s, which approximates the 200-day at 20.53.
This week’s drop in VIX preceded a rare positive correlation between the volatility index and the S&P 500 last week, as both fell (more on this here). Concurrently, VIX failed to sustainably stay above 32-33 and made lower highs since the January 24 high of 38.94.
The daily is beginning to get oversold. Volatility bulls should be able to defend low-20s.
Thanks for reading!
