
Following futures positions of non-commercials are as of June 7, 2022.
10-year note: Currently net short 266.2k, up 27.3k.
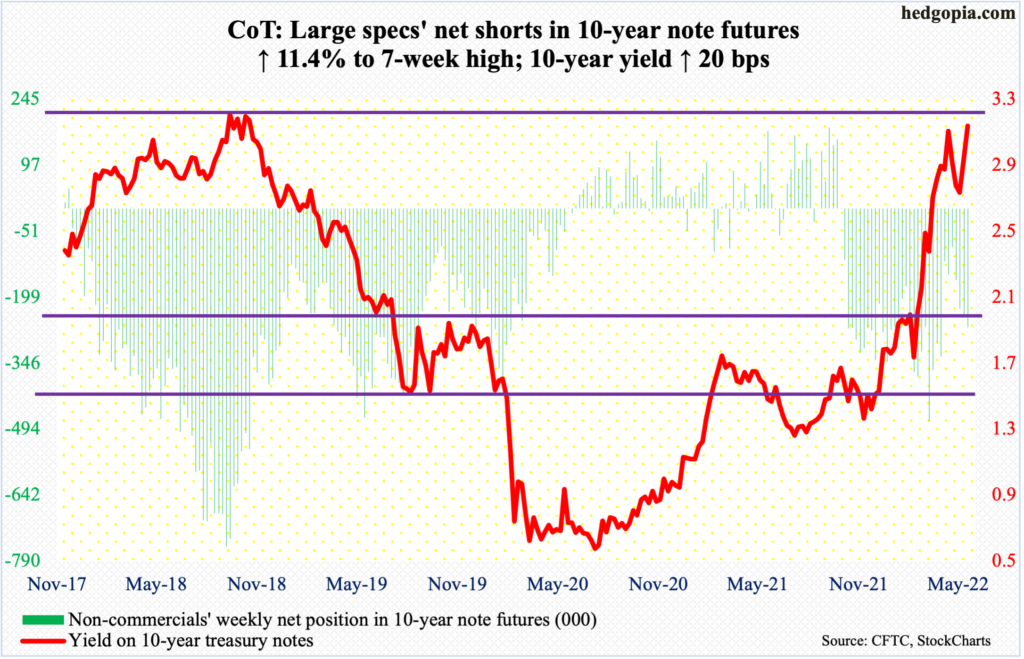
Next week is FOMC meeting. This is the year’s fourth scheduled meeting; four more remain. Leading up to this, the Fed raised twice – by 25 basis points in March (15-16) and 50 basis points in May (3-4). At the March meeting, Chair Jerome Powell knocked down markets’ expectations for a 75-basis-point hike but said a couple of 50 was possible. Futures traders quickly adjusted to this guidance.
A 50-basis-point increase next week is priced in. Until Friday’s CPI report which showed consumer inflation jumping 8.6 percent year-over-year in May, these traders expected two more increases of that magnitude in July (26-27) and September (20-21), followed by two more 25-basis-point moves in November (1-2) and December (13-14), ending the year at a range of 275 basis points to 300 basis points.
Post-CPI, the fed funds rate is now expected to end 2022 at least between 300 basis points and 325 basis points, including a possible 75 in July. The benchmark rate is currently at a range of 75 basis points to 100 basis points.
Given how markets are positioned, any hints of a change in the interest rate outlook next week is bound to reverberate through all kinds of assets, not the least of which are equities and treasury securities. In this regard, if the message leans dovish, that probably will be treated with much more exuberance than if the Fed were to sound more hawkish.
Amidst this, there are continued signs that economic activity is in deceleration, including a collapse in high-yield bond issuance in the first five months (more on this here).
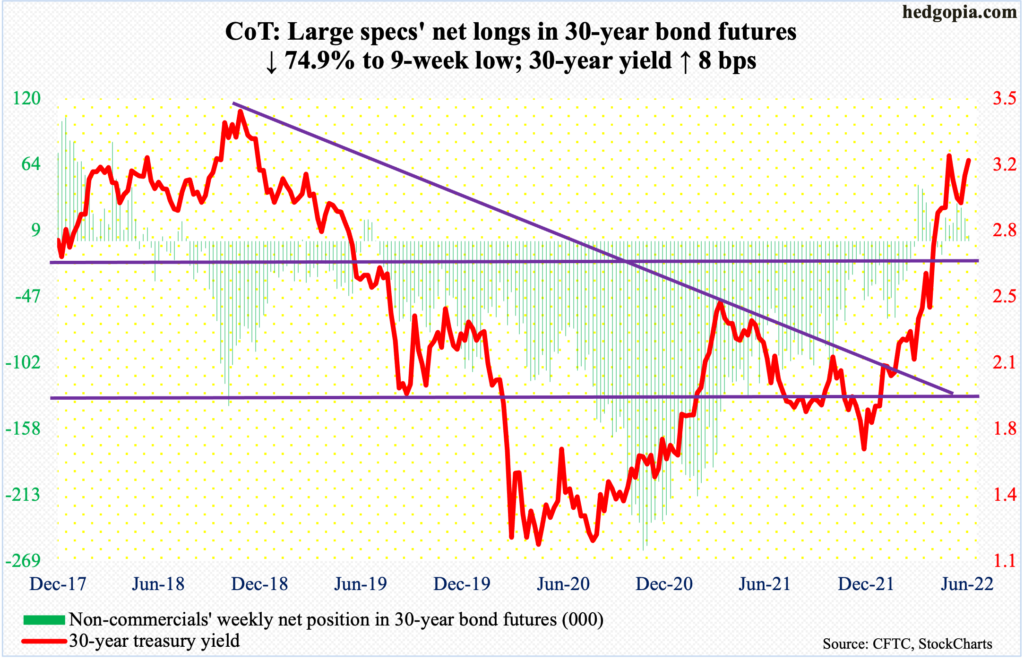
30-year bond: Currently net long 5k, down 14.8k.
Major economic releases for next week are as follows.
The NFIB Optimism Index (May) and the producer price index (May) are due out on Tuesday.
Small-business optimism remained unchanged month-over-month in April at 93.2. This was a two-year low.
In the 12 months to April, headline and core wholesale prices rose 11 percent and 6.9 percent respectively.
Retail sales (May), the NAHB Housing Market Index (June) and Treasury International Capital data (April) will be published on Wednesday.
Retail sales increased 0.9 percent m/m in April to a seasonally adjusted annual rate of $677.7 billion – a new record. Two years ago, post-pandemic in April 2020, sales languished at $407 billion.
Homebuilder optimism tumbled eight points m/m in May to 69 – the lowest since June 2020.
In the 12 months to March, foreigners sold $180.3 billion in US stocks. This was a third straight month of net selling. A year ago in March, they were buying $404.7 billion, which set a record.
Thursday brings housing starts (May). April starts were up 1.5 percent m/m to 1.8 million units (SAAR), which was the highest since May 2006.
Industrial production (May) is on dock for Friday. Capacity utilization rose a percent m/m in April to 78 percent. This was the best showing since December 2018.
WTI crude oil: Currently net long 345.3k, down 2.7k.
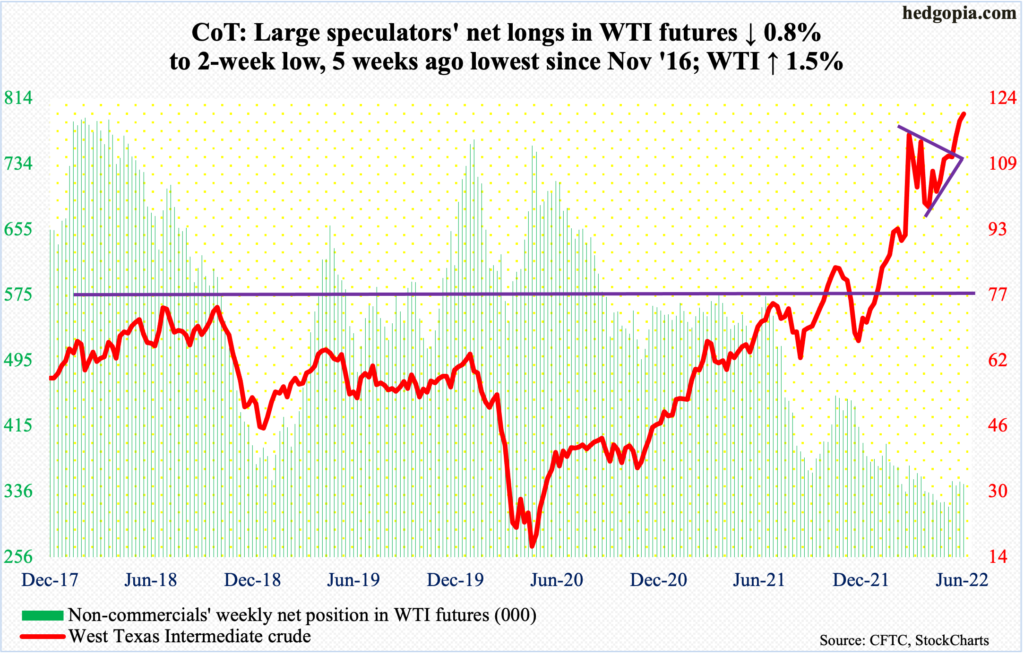
One more week and one more weekly high, although the week ended in a long-legged doji. For the ninth week in a row, WTI ($120.67/barrel) kept up a pattern of higher highs/higher lows, with Wednesday tagging $123.18 intraday, which was a three-month high.
Earlier in March, the crude ticked $130.50 before retreating. Last December, WTI bottomed at $66.12.
Importantly this week, bids showed up just north of $117 on Tuesday; this level has drawn interest from both bulls and bears going back to early March. This is the one to watch for now. After this lies horizontal support at $115-$116. So long as the price remains above this, bulls deserve the benefit of the doubt.
In the meantime, US crude production in the week to June 3 remained unchanged at 11.9 million barrels per day. Crude imports declined 64,000 b/d to 6.2 mb/d. As did inventory of gasoline, which fell 812,000 barrels to 218.2 million barrels. Stocks of crude and distillates, however, rose – up two million barrels and 2.6 million barrels to 416.8 million barrels and 109 million barrels. Refinery utilization increased 1.6 percentage points to 94.2 percent.
E-mini S&P 500: Currently net short 17k, up 38.9k.
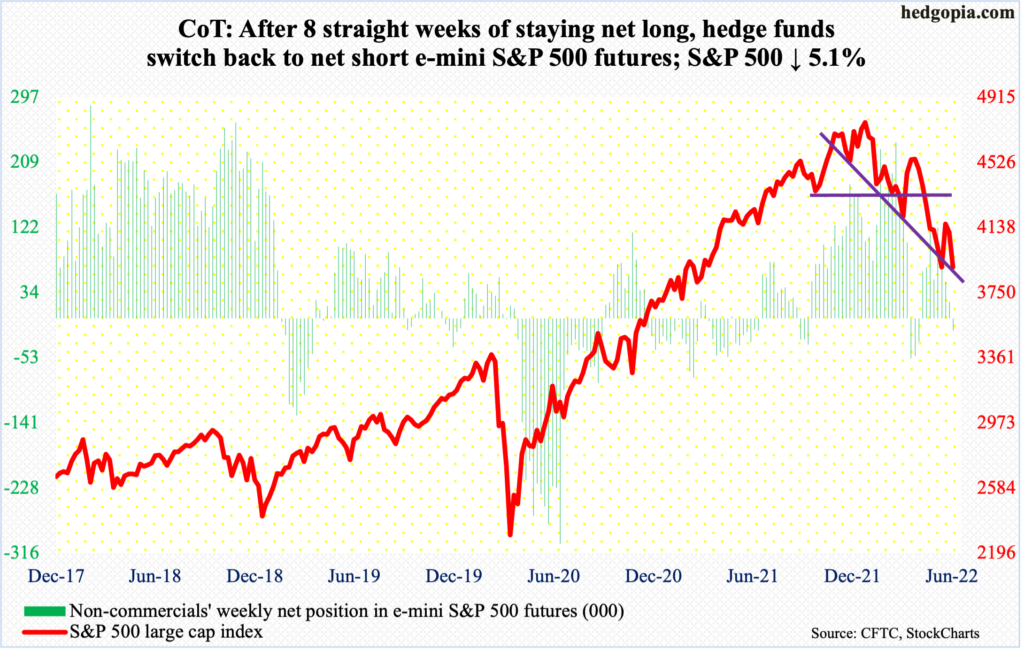
For the last couple of weeks, the S&P 500 was rangebound between 4160s and 4070s. After unsuccessfully trying to take out the ceiling in the first three sessions this week, the floor gave in on Thursday, as the large cap index tumbled 2.4 percent. Come Friday, it plunged another 2.9 percent, for a weekly loss of 5.1 percent.
There is room for the daily to continue lower.
On May 20, the S&P 500 (3901) reversed higher after touching 3810 intraday. From the January 4 high of 4819 through that low, it dropped 20.9 percent. Last month’s low could very well be in play. A breach raises the odds it heads toward 3750s, which represents the lower range of a descending channel in place since January.
Euro: Currently net long 50.5k, down 1.7k.
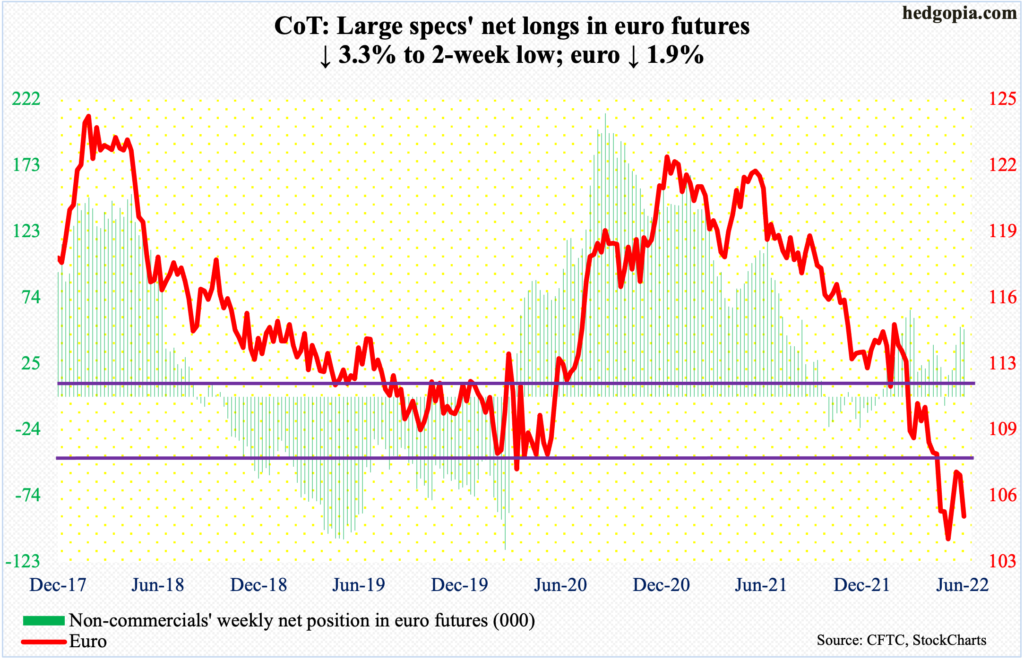
The European Central Bank announced on Thursday that it would raise benchmark rates by 25 basis points next month and again in September, also saying it would end its bond-buying program at the start of July.
In reaction, the euro tried to rally in the opening minutes of that session, tagging $1.0774 but reversed hard to end the session down 0.9 percent, to $1.0618. On Friday, it gapped lower 0.9 percent to $1.0521.
Leading up to this, the currency had stalled around horizontal resistance at $1.0750s for the last several sessions; no breakthrough came about. And the euro went the other way.
Three weeks ago, there was a bullish island reversal near the January 2017 low of $1.0341, which is now in play.
Gold: Currently net long 175.3k, up 2.7k.
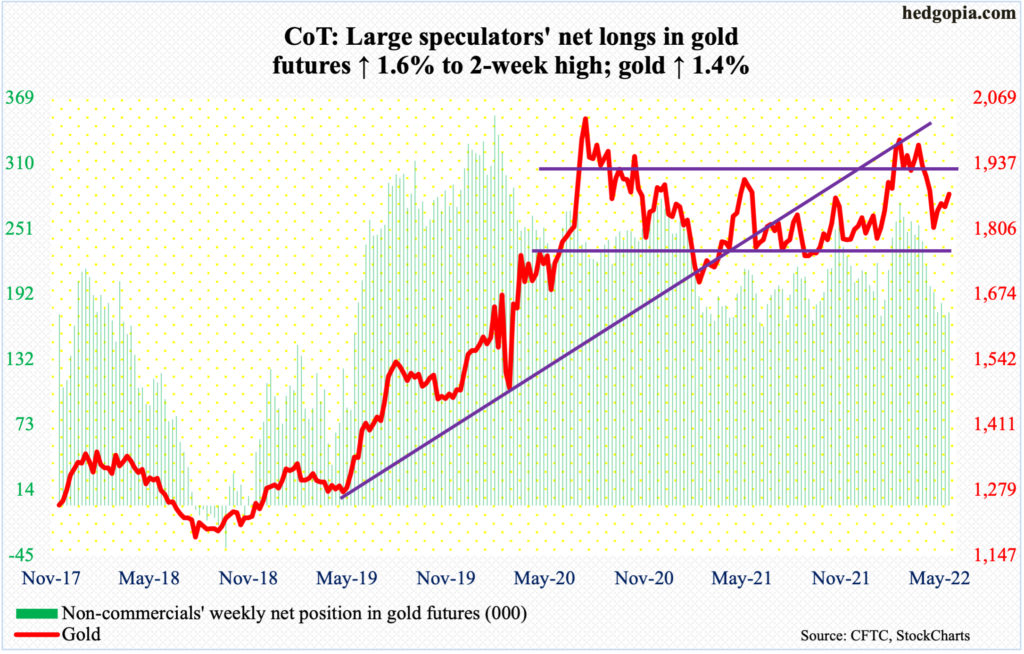
Until Thursday, gold straddled its 200-day for a month. Friday was a volatile session, with a high of $1,880 and a low of $1,826, closing at $1,875/ounce, well past the average at $1,843. This also helped recapture a broken rising trend line from last August. In the preceding three weeks, the metal closed right at that line.
It so happens the yellow metal closed out the week right at horizontal resistance at $1,870s. Next week’s action is key.
Nasdaq 100 index (mini): Currently net long 17k, up 11.4k.
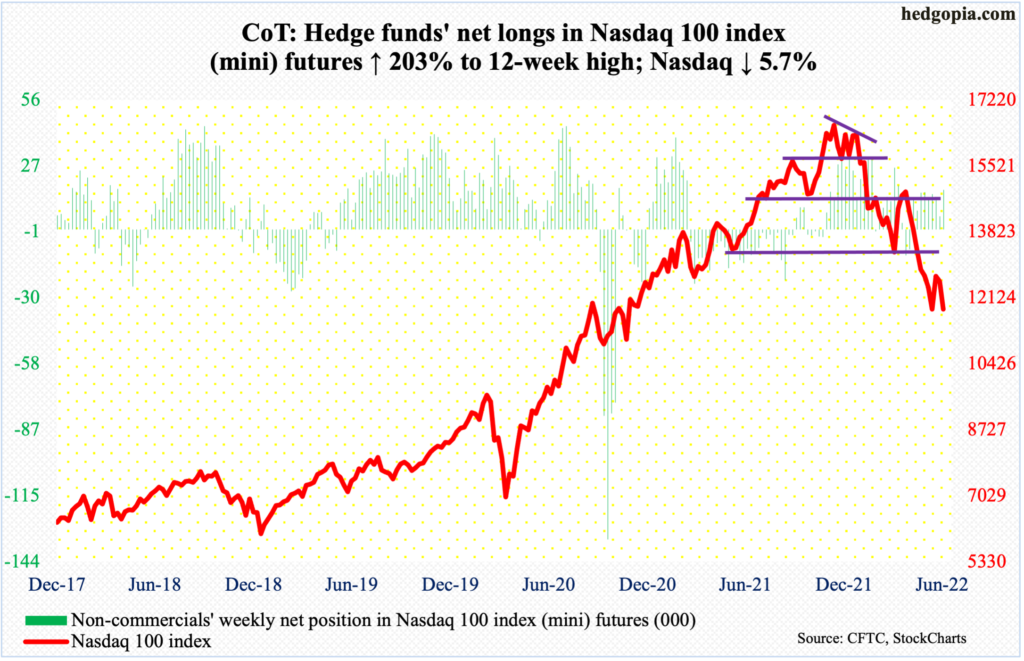
Last week, there was a crossover between the 10- and 20-day. Tech bulls this week were unable to cash in on this potentially bullish development, as the Nasdaq 100 (11833) reversed from up two percent at Monday’s high to down 5.7 percent when it was all said and done.
This was the second straight down week. This followed a 7.2-percent jump, which itself came after seven consecutive weeks of decline.
As things stand, the daily seems to want to go lower. Depending on how things shake out, the May 20 low of 11492 is a must-hold.
Russell 2000 mini-index: Currently net short 73.6k, down 5k.
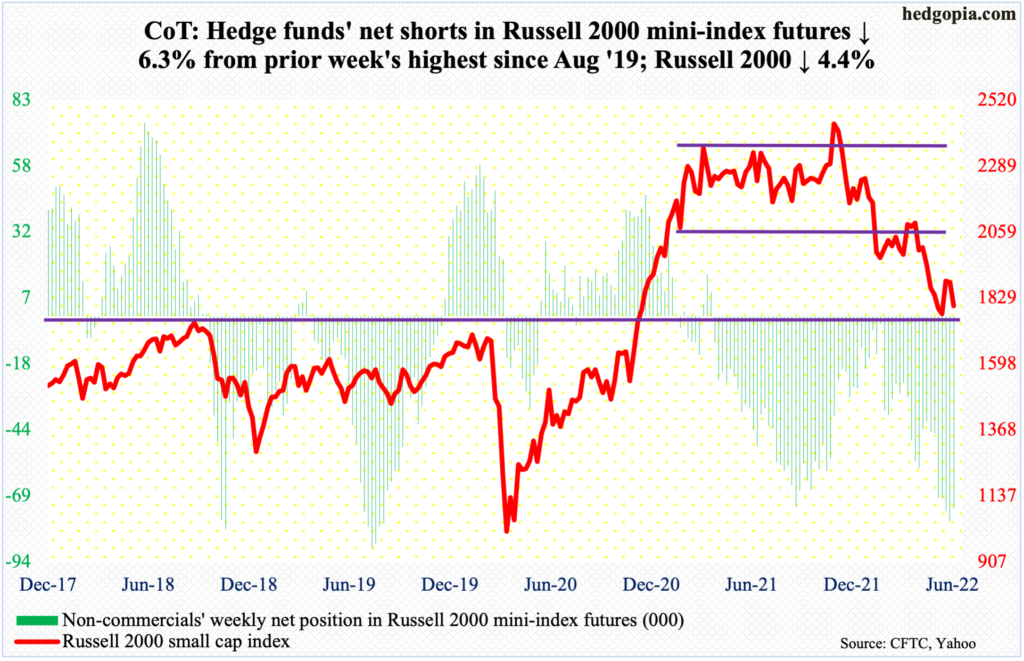
The Russell 2000 played ping pong between 2080s and 1900 for three months before breaching the support in late April. Before that in mid-January, a major range breakdown occurred, losing 2080s; for 10 months, it went back and forth between 2080s and 2350s.
Last week, 1900 was tested for the first time since suffering the late-April breach – unsuccessfully. This week, small-cap bulls recaptured the level intraweek, tagging 1920 on Tuesday, but failed to hang on to it. It closed out the week at 1800.
On May 12, the small cap index ticked 1701. This was a successful defense of a breakout from November 2000. This preceded a 30.8-percent drop between last November’s record high and that low.
The index finds itself right in the middle of 1700 and 1900, with a downward bias in the sessions ahead.
How small-caps behave can be a tell where investors view the US economy is headed (more on this here).
US Dollar Index: Currently net long 37.9k, up 400.
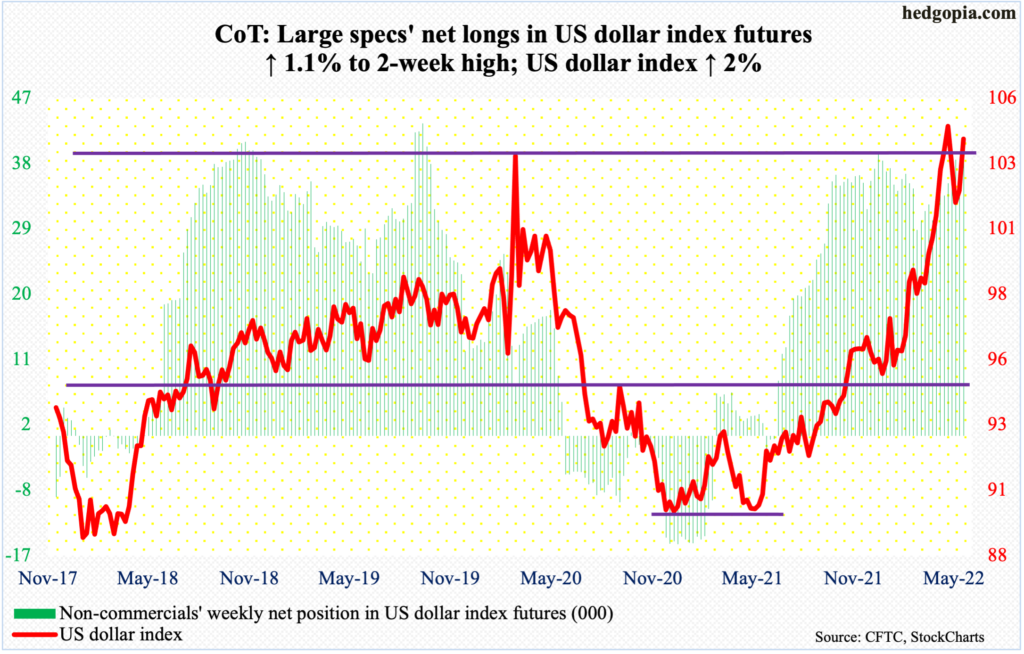
Short-term resistance at 102.70s was taken care of on Thursday when the US dollar index rallied 0.7 percent. This was followed by another 0.9-percent rally on Friday, ending the week up two percent.
The daily MACD just developed a bullish crossover. The index rallied from 89.17 in January last year to 105.06 on May 13 (this year). On its way there, the index broke out of just south of 104, which acted as a ceiling going back to January 2017. Breakout retest failed on the 17th. Dollar bulls have another opportunity to decisively reclaim this. The index ended the week at 104.15.
VIX: Currently net short 57.3k, up 12.6k.
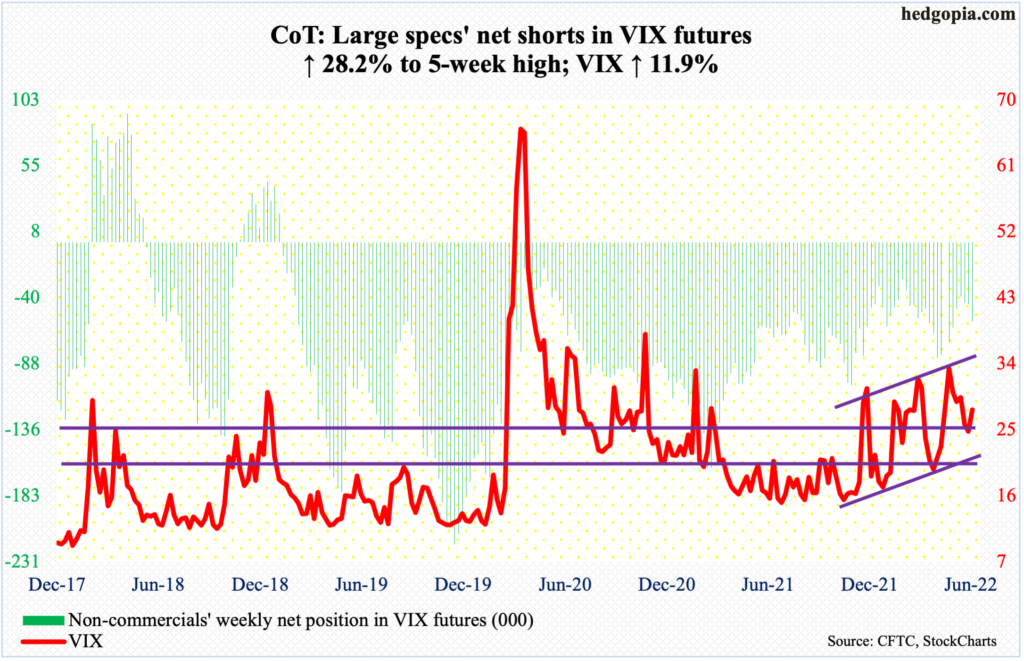
The 200-day (22.99) was not quite tested before volatility began to perk up. On Tuesday through Thursday, VIX stopped going down just below 24. The average also approximates horizontal support at low-20s.
Before Thursday’s and Friday’s action, the volatility index was getting oversold. The rally in those two sessions helped VIX reclaim mid-20s resistance. There is room for the daily to continue higher.
With that said, volatility bulls probably are not that happy about how Friday evolved; intraday, VIX rose as high as 29.63 but only to leave behind a long upper wick to close at 27.75.
Thanks for reading!
