Following futures positions of non-commercials are as of June 28, 2022.
10-year note: Currently net short 181.7k, down 46.5k.
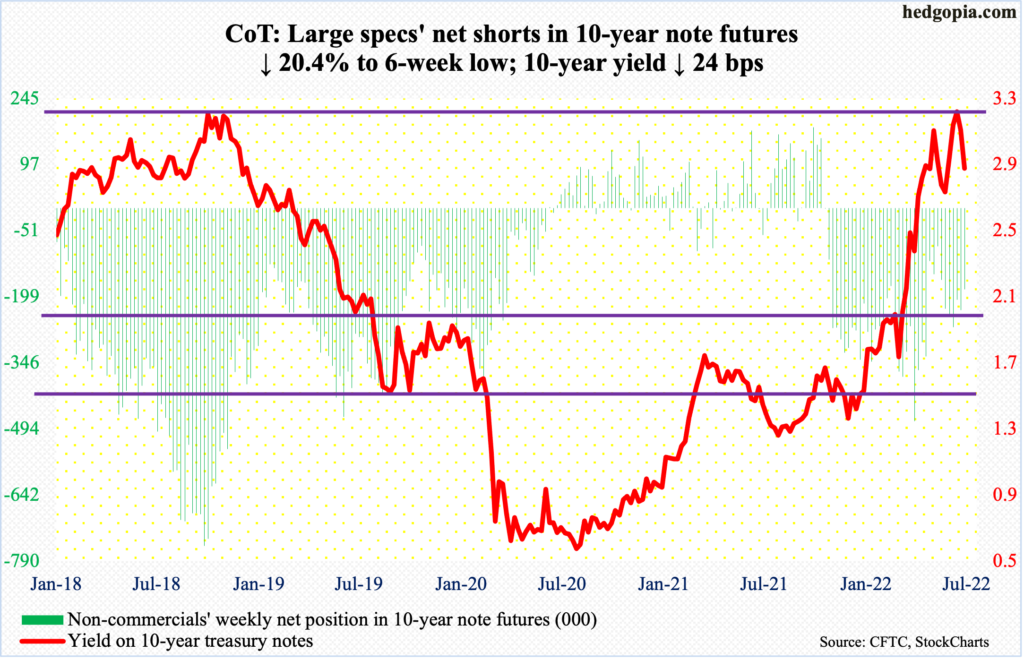
A couple of weeks after forming a weekly shooting star, it is looking more and more likely that the 10-year treasury yield has peaked in this cycle.
On June 14, rates hit 3.48 percent but only to begin to come under pressure in the very next session. At the end of 2021, the 10-year yielded 1.49 percent and 1.13 percent last July/August.
In between, inflation surged, with headline and core PCE (personal consumption expenditures) in May rising 6.4 percent and 4.7 percent year-over-year respectively. May’s pace is slower than the 6.6 percent and 5.3 percent witnessed in March and February respectively; at the peak, inflation was surging at a four-decade high.
Besides, the Fed is tightening and wants to tighten more. Apart from shrinking its bloated balance sheet, the central bank raised the fed funds rate by 75 basis points in June to a range of 150 basis points to 175 basis points, coming on the heels of hikes of 50 basis points in May and 25 basis points in March. In the futures market, traders are betting on another 75 this month, a 50 in September, a 25 each in November and December – to between 325 basis points and 350 basis points by the end of the year.
If rates indeed get there in the next six months, one wonders what that would do to a leveraged economy. The bond market is beginning to wonder as well.
In this regard, 2.70s on the 10-year is worth watching. A breach of this level can lead shorts (on price) to begin to cover. Yields ended the week at 2.89 percent, down 24 basis points week-over-week.
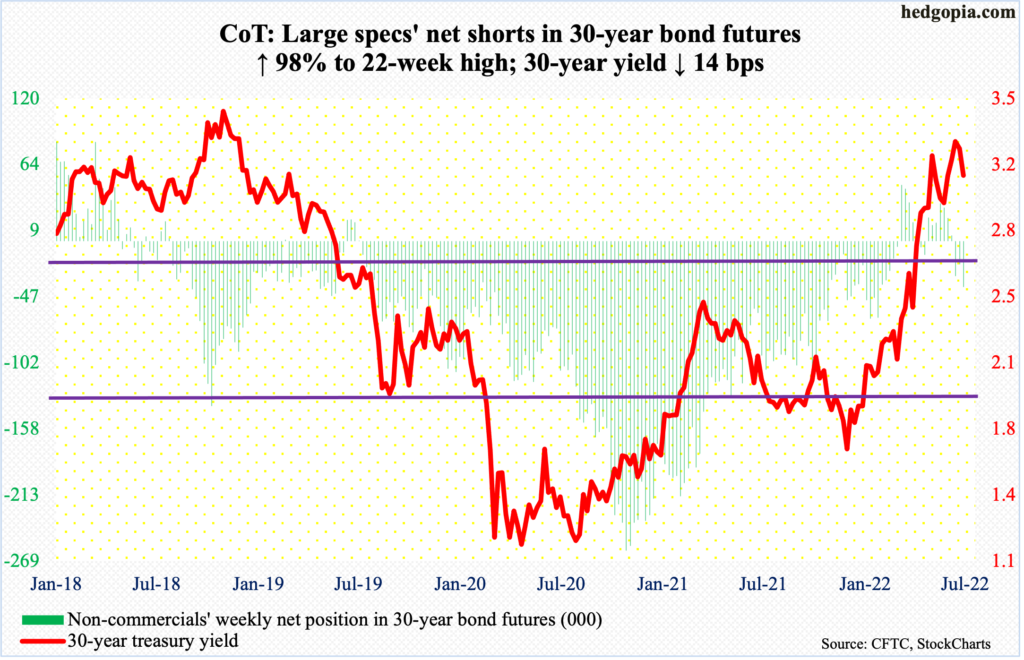
30-year bond: Currently net short 38.3k, up 18.9k.
Major economic releases for next week are as follows. Markets are closed Monday for observance of Independence Day!
Durable goods orders (revised, May) are scheduled for Tuesday. Preliminarily, orders for non-defense capital goods ex-aircraft – proxy for business capex plans – increased 0.5 percent month-over-month to a seasonally adjusted annual rate of $73.5 billion. This was a new high.
The ISM non-manufacturing index (June) and job openings (JOLTs, May) are due out Wednesday.
Services activity decreased 1.2 percentage points m/m in May to 55.9 percent.
In April, non-farm openings dropped 455,000 m/m from March’s record 11.9 million.
Friday brings payroll (June). May added 390,000 non-farm jobs, for a monthly average this year of 488,000, versus a monthly average last year of 562,000.
WTI crude oil: Currently net long 290.5k, up 8.9k.
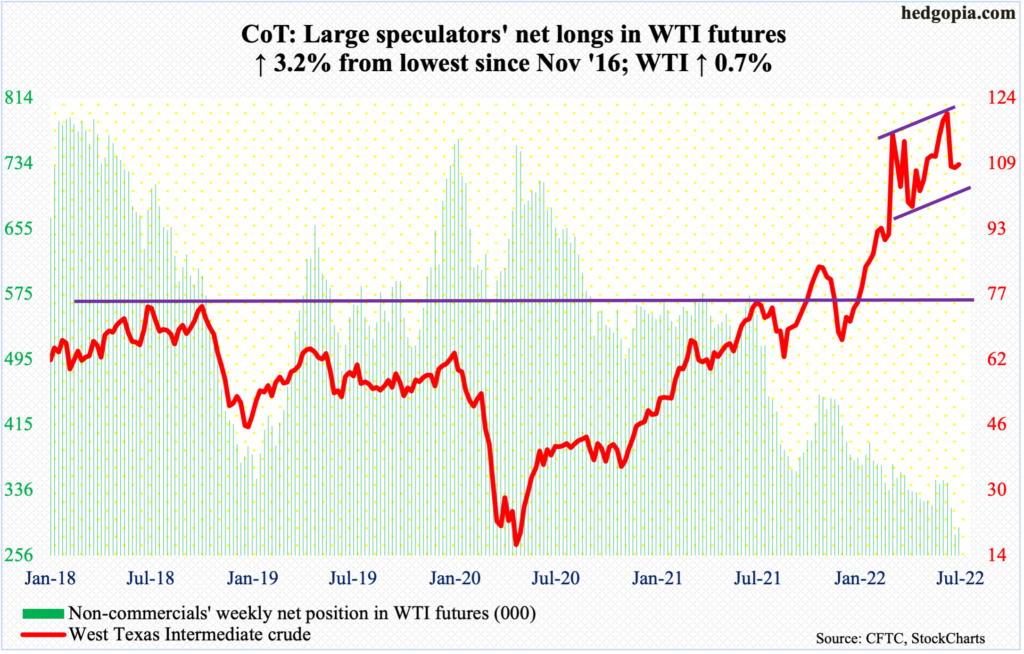
Momentum, represented by the daily RSI, retreated from the median early this week. Come Wednesday, sellers showed up at the 20-day moving average. By Thursday, the 50-day was compromised.
The crude ($108.43/barrel) has come under pressure since tagging $123.68 intraday on June 14, which represents a lower high versus $130.50 posted on March 7. It has traded within an ascending channel since April, which was lost intraday Friday but saved by close; a breach raises the odds WTI heads toward $93-$94; the 200-day lies at $92.18.
In the meantime, per the EIA, US crude production in the week to June 24 increased 100,000 barrels per day to 12.1 million b/d. As did stocks of gasoline and distillates, which each rose 2.6 million barrels to 221.6 million barrels and 112.4 million barrels respectively. Crude inventory, however, fell – down 2.8 million barrels to 415.6 million barrels. Crude imports, too, declined by 228,000 b/d to six mb/d. Refinery utilization increased a percentage point to 95 percent.
E-mini S&P 500: Currently net short 139.2k, up 24.9k.
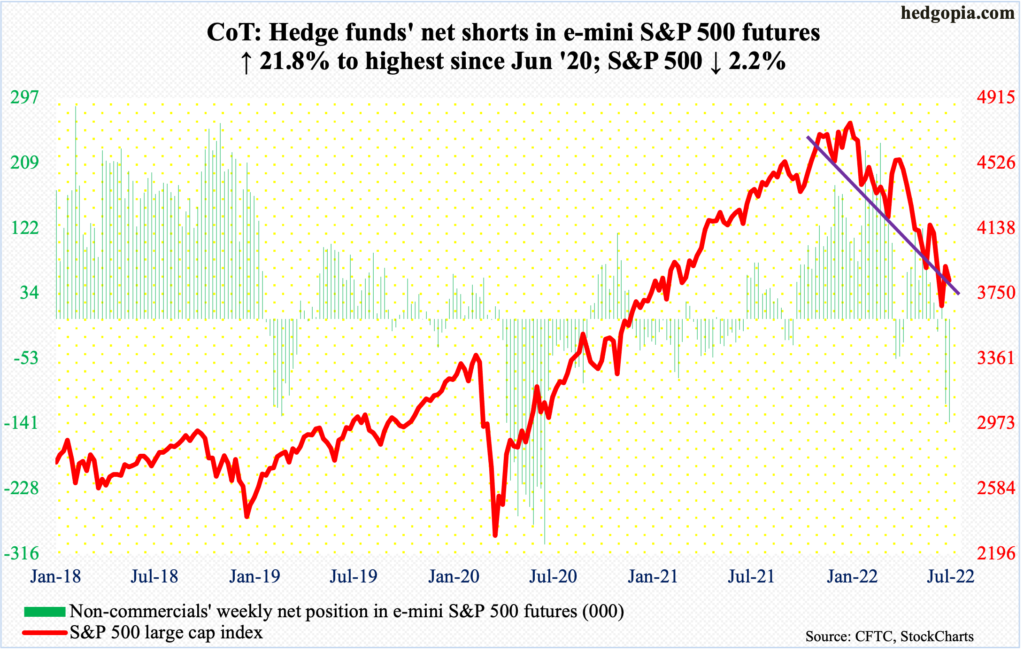
Equity bulls were unable to build on last week’s momentum. At Tuesday’s high, the S&P 500 was up 0.9 percent, but when it was all said and done ended the week down 2.2 percent. This was the 11th down week in the last 13.
The large cap index (3825) remains above the June 16-17 lows of 3630s and that is good as far as longs are concerned. But shorts remain aggressive. Mid-June, SPY (S&P 500 SPDR ETF) short interest rose to the highest since the end of February last year (chart here). These shorts have done well but at the same can contribute to a rally if forced to cover.
On the weekly, there is plenty of room for strength. Improved flows will go a long way, and that is yet to happen meaningfully.
In the week to Wednesday, $8 billion was redeemed from US equity funds, after losing a combined $21.6 billion in the prior two (courtesy of Lipper). SPY (SPDR S&P 500 ETF), VOO (Vanguard S&P 500 ETF) and IVV (iShares Core S&P 500 ETF) in the week to Wednesday gained, but merely $1.9 billion (courtesy of ETF.com).
Euro: Currently net short 10.6k, down 5k.
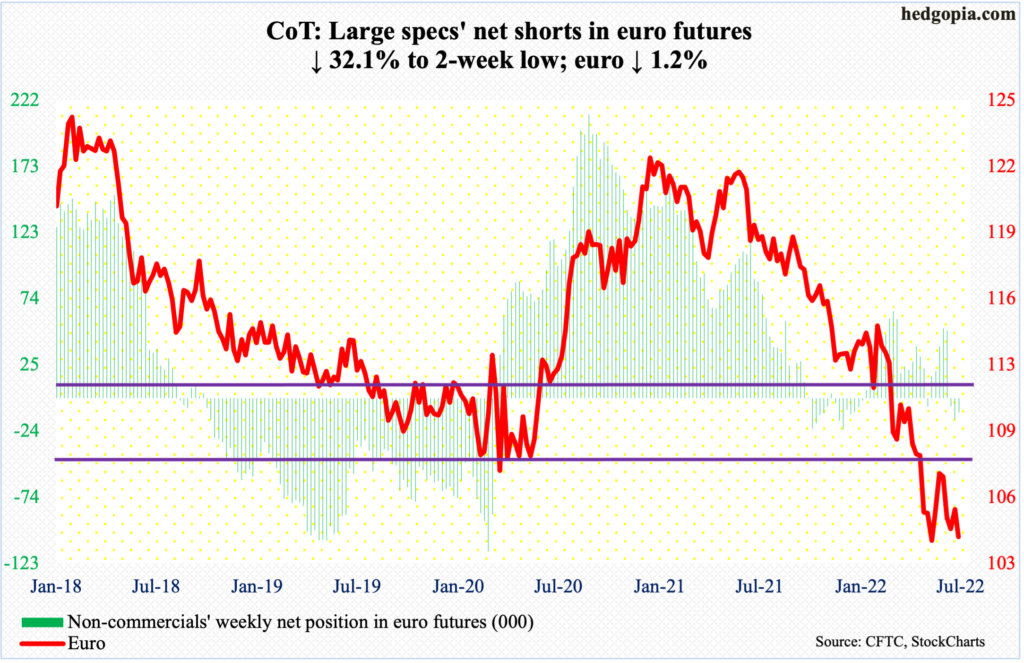
Euro bears once again tested the May-June lows this week but were unable to penetrate. On June 15, the currency tagged $1.0358, just about matching the May 13 low of $1.0350, which was a successful retest of the January 2017 low of $1.0341. Intraday Friday, $1.0367 was ticked before closing at $1.0429 for a potentially bullish hammer.
Earlier, the euro peaked at $1.2345 in January last year. For a couple of months now, sellers have consistently showed up at $1.0570s, or a little higher. On Monday, the euro ticked $1.0615 and was rejected at the 50-day. A takeout of the average ($1.0580) opens the door toward $1.0750s.
Gold: Currently net long 157.7k, down 5.6k.
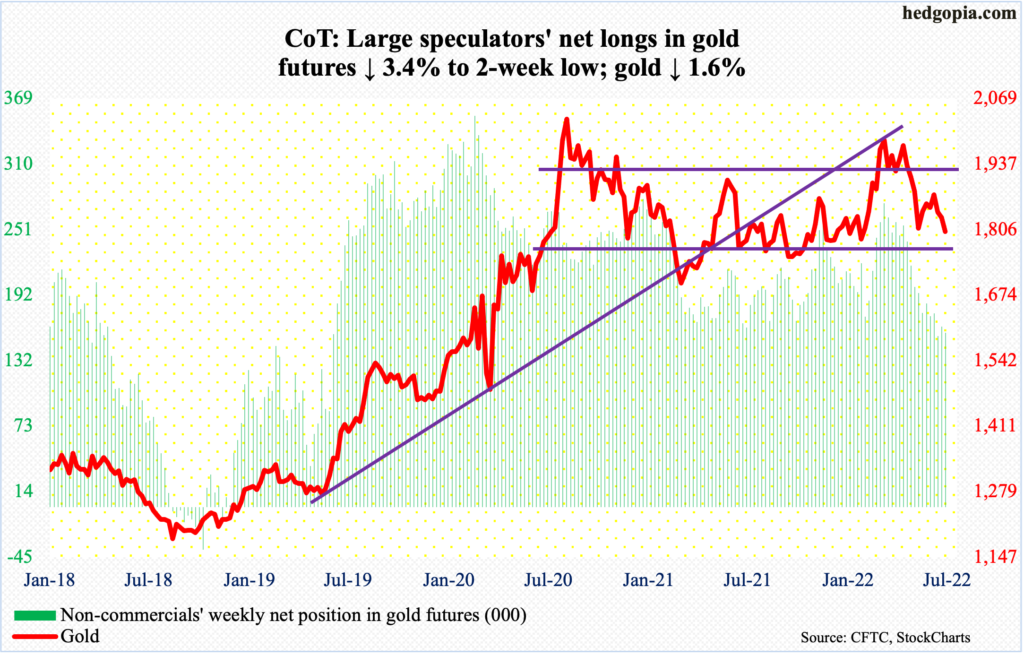
Gold ($1,801/ounce) acts like it wants to go test horizontal support at $1,770s, which was last tested in May and in January before that – both successfully.
On June 13, the metal touched $1,883 before being repelled just under the 50-day (now $1,852). For a test of $1,770s to occur, gold needs to breach a rising trend line from March last year. Gold bugs cannot afford to lose both.
Nasdaq 100 index (mini): Currently net long 24.2k, down 6.6k.
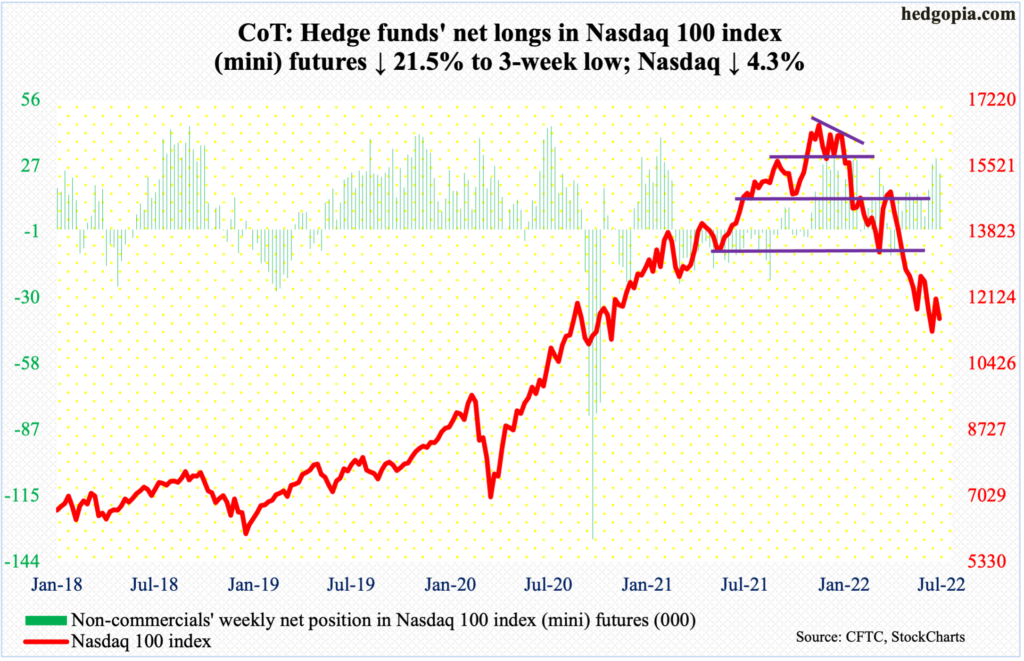
Monday’s intraday high of 12176 just came short of filling a June 10th gap-down at 12266. As soon as this happened, sellers hurriedly showed up and several daily indicators such as the RSI and the CCI turned back down from the median.
On June 16, the Nasdaq 100 (11586) stopped going down after ticking 11037 and went on to rally north of 10 percent through the afore-mentioned high. Through that low, the tech-heavy index tumbled 34.2 percent from last November’s record high 16765; this also represented a successful defense of a falling trend line from late last year (more on this here).
The weekly is itching to rally.
Russell 2000 mini-index: Currently net short 104.6k, down 976.
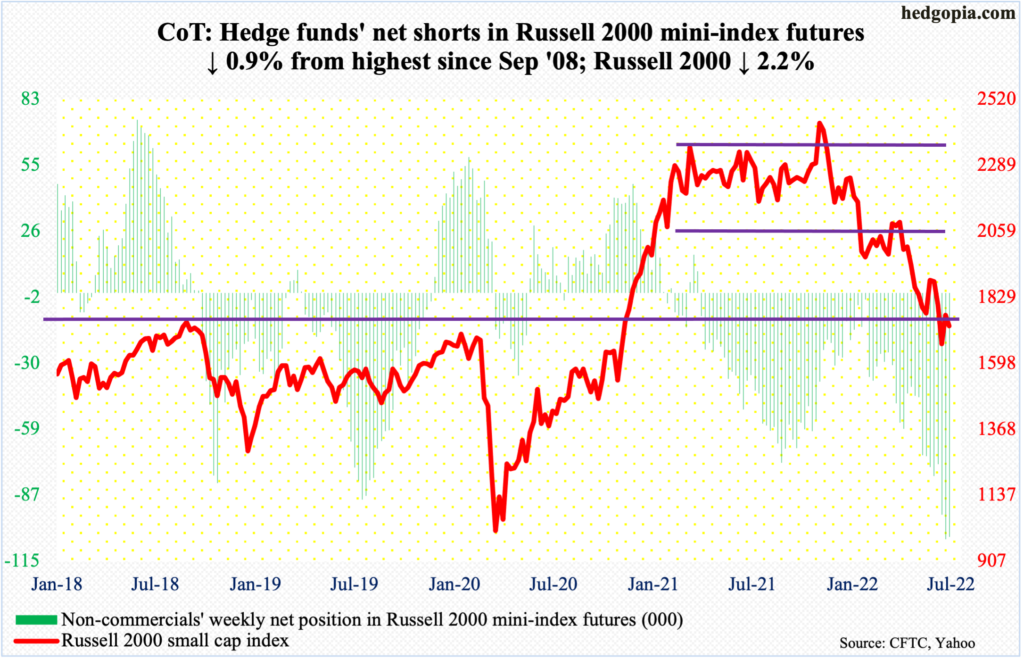
On June 7, the Russell 2000 retreated after tagging 1920 intraday. In the subsequent selloff, there were two gap-downs – one on the 10th and the other on the 13th; this Tuesday, 1793 was hit intraday, and as soon as the latter gap was filled, sellers appeared.
For small-cap bulls, the good thing is that on both Thursday and Friday, the index was pushed back below 1700, which is where the index broke out of in November 2000, but only to reclaim the level by close.
Earlier, a major breakdown occurred mid-January, losing 2080s; for 10 months, the Russell 2000 (1728) went back and forth between 2080s and 2350s. After that, it seesawed between 2080s and 1900. Then came the 1900-1700 range. Defense of 1700 opens the door toward 1900.
US Dollar Index: Currently net long 43.2k, down 1.8k.
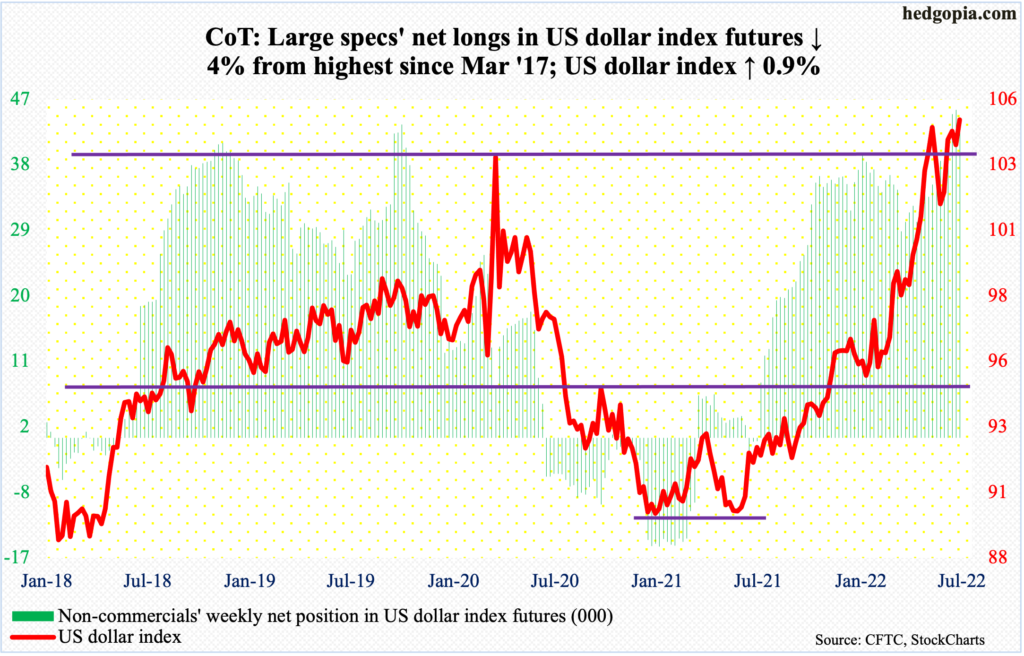
The US dollar index intraday Friday went after the June 15th high of 105.56 touching 105.44 but this lured sellers more than buyers into action. That said, the index remains above 104, which acted as a ceiling going back to January 2017.
From 89.17 in January last year through the afore-mentioned high, the US dollar index rallied strong. Amidst this, there are subtle signs of fatigue, with a back-to-back weekly spinning top last week and the week before that. This week, too, it ranged from 105.44 and 103.42, closing at 104.91.
A loss of 104 will bring short-term horizontal support at 102.70s into focus, followed by lateral support at 101.40s.
VIX: Currently net short 49.6k, down 354.
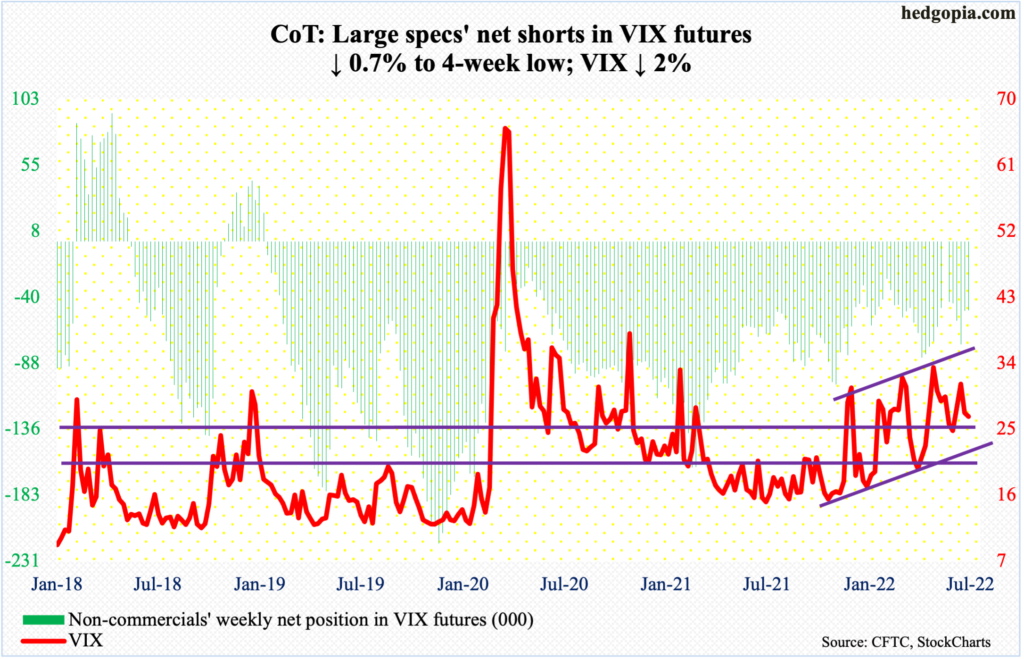
VIX continues to trade within a pennant. It has made lower highs since January this year when the volatility index tagged 38.94. Concurrently, it has made higher lows since November 2017 when VIX tagged an all-time low of 8.56 and most recently since July last year.
This week, volatility bulls struggled to build on Tuesday’s defense of horizontal support at mid-20s. On Friday, VIX sliced through the 50-day. In perhaps a telling sign for the sessions to come, both VIX and the S&P 500 were down this week. In all probability, VIX wants to go lower.
Thanks for reading!

