
Following futures positions of non-commercials are as of September 20, 2022.
10-year note: Currently net short 229.6k, down 123.3k.
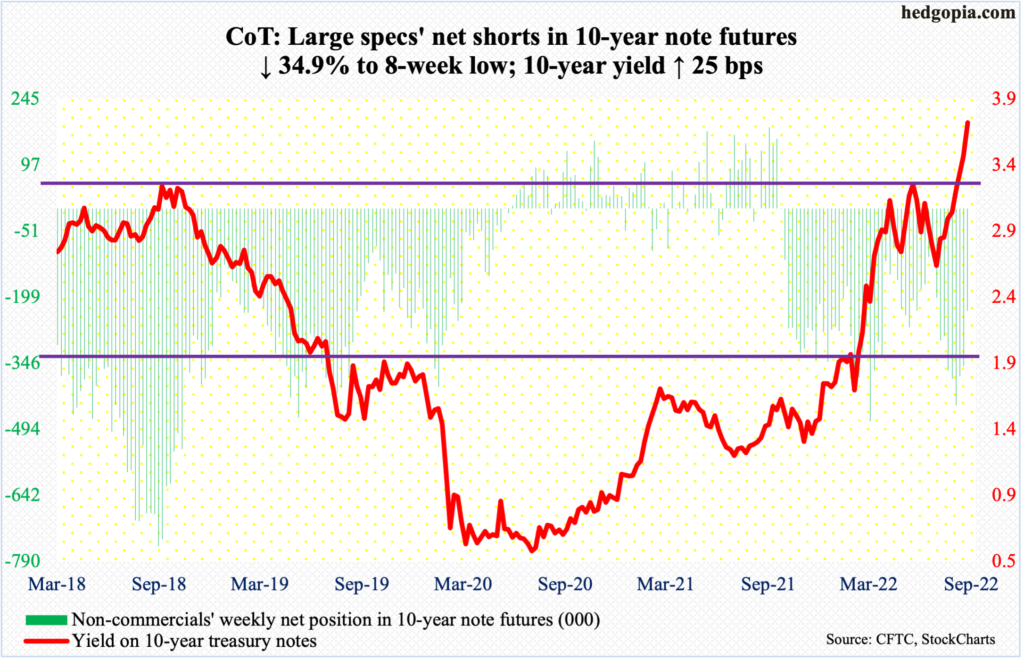
Hope springs eternal. One cannot help but think of this phrase considering how risk assets reacted to this week’s FOMC action. In the futures market, traders were all ready for a 75-basis-point move, with some even entertaining the possibility of a full percentage point increase.
When it was all said and done, the fed funds rate was pushed up by 75 basis points, to a range of 300 basis points to 325 basis points. Chair Jerome Powell signaled more aggressive hikes ahead. This should not have come as a surprise, come to think of it, but it did. The thing is, he has been prepping the market for this – particularly since the Jackson Hole symposium toward the end of August.
Yet, equities tumbled post-FOMC decision. It turns out, deep down, markets were still hoping that Powell would signal a pivot, which did not come. Futures traders now expect the benchmark rates to end the year between 425 basis points and 450 basis points, with a 75 in November and a 50 in December priced in.
The bigger worry for equity investors is that Powell increasingly is suggesting – convincingly, we might add – that they are determined to bring inflation under control and that a recession would not going to slow them down. This scenario will have adverse consequences, not the least of which are corporate earnings, which will then have a bearing on stock prices.
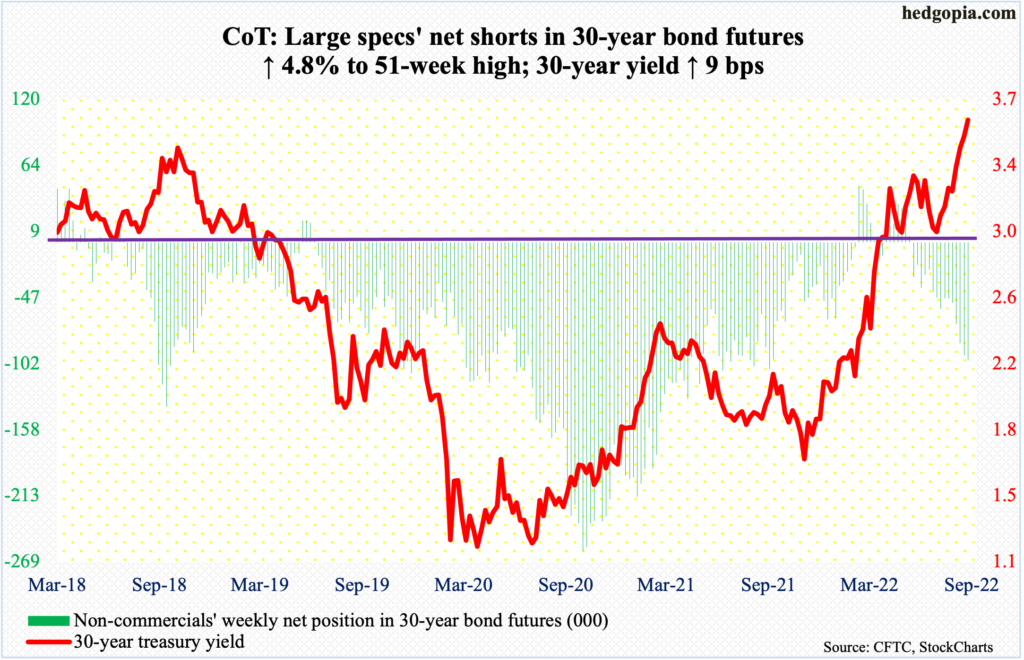
30-year bond: Currently net short 99.5k, up 4.6k.
Major economic releases for next week are as follows.
Tuesday brings durable goods orders (August), the S&P Case-Shiller home price index (July) and new home sales (August).
July orders for non-defense capital goods ex-aircraft – proxy for business capex plans – grew 0.3 percent month-over-month to a seasonally adjusted annual rate of $74.4 billion, which set a new record.
In July, US home prices jumped 18 percent year-over-year. Prices are still rising but at a decelerating pace. They were rising at record 20.6 percent in April (this year).
Sales of new homes in July shrank 12.6 percent m/m to 511,000 units (SAAR), which was the lowest since January 2016.
GDP (2Q22, third estimate) and corporate profits (2Q22, final) are scheduled for Thursday.
The second estimate showed real GDP shrank 0.6 percent in 2Q, coming on the heels of 1.6-percent contraction in 1Q. This was the first back-to-back contraction in economic activity since 2Q20.
Preliminarily in 2Q, corporate profits increased 6.1 percent quarter-over-quarter to $3.05 trillion – a new record.
The PCE price index (August) and the University of Michigan’s consumer sentiment index (September, final) are on dock for Friday.
In the 12 months to July, headline PCE (personal consumption expenditures) jumped 6.3 percent. June’s 6.8-percent rise was the steepest since January 1982.
September’s preliminary estimate showed consumer sentiment rose 1.3 points m/m to 59.5 – a five-month high.
WTI crude oil: Currently net long 251k, up 10k.
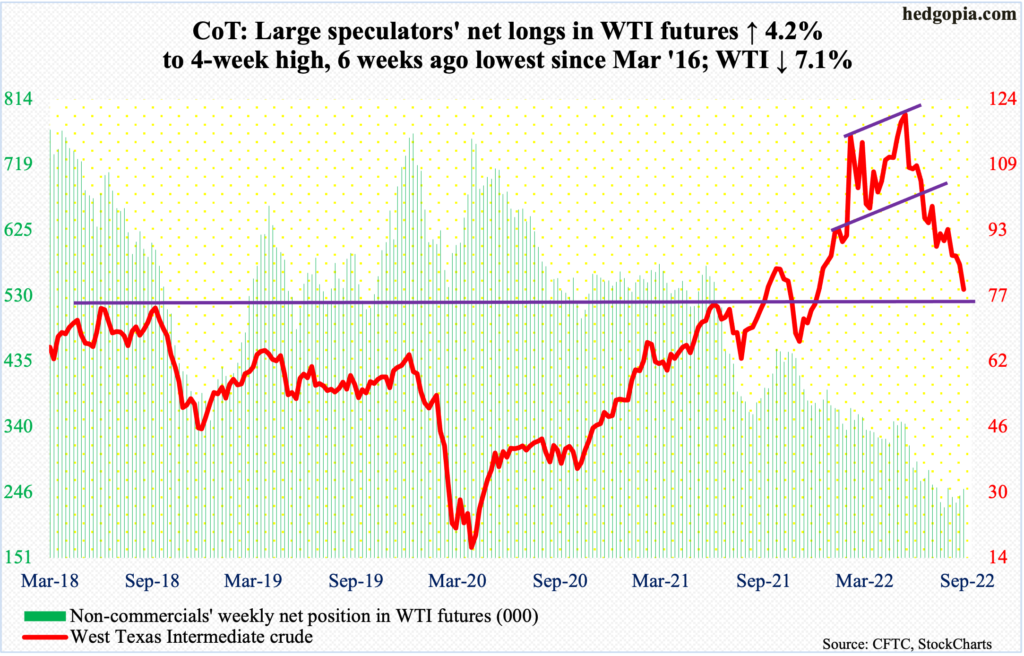
After losing lateral support at $85, or just underneath, two weeks ago, several attempts this week to recapture the level met with failure.
In addition, come Friday, WTI sliced through the September 8th low of $81.20, tagging $78.04 intraday and closing at $78.74/barrel.
The crude peaked at $123.68 in June and at $130.50 in March before that, before losing upward momentum. Subsequently, bulls lost important horizontal support at $93. A loss of $85 is another bearish development. Oil bulls absolutely cannot afford to lose $75, or thereabouts; this has been an important price point going back to April 2006.
That said, the momentum is clearly down.
In the meantime, per the EIA, US crude production in the week to September 16 was unchanged at 12.1 million barrels per day; this was the fourth week in a row output has remained unchanged. Crude imports increased 1.2 mb/d to 6.9 mb/d. As did stocks of crude, gasoline, and distillates, which respectively rose 1.1 million barrels, 1.6 million barrels and 1.2 million barrels to 430.8 million barrels, 214.6 million barrels and 117.3 million barrels. Refinery utilization rose 2.1 percentage points to 93.6 percent.
E-mini S&P 500: Currently net short 219.5k, down 61.6k.
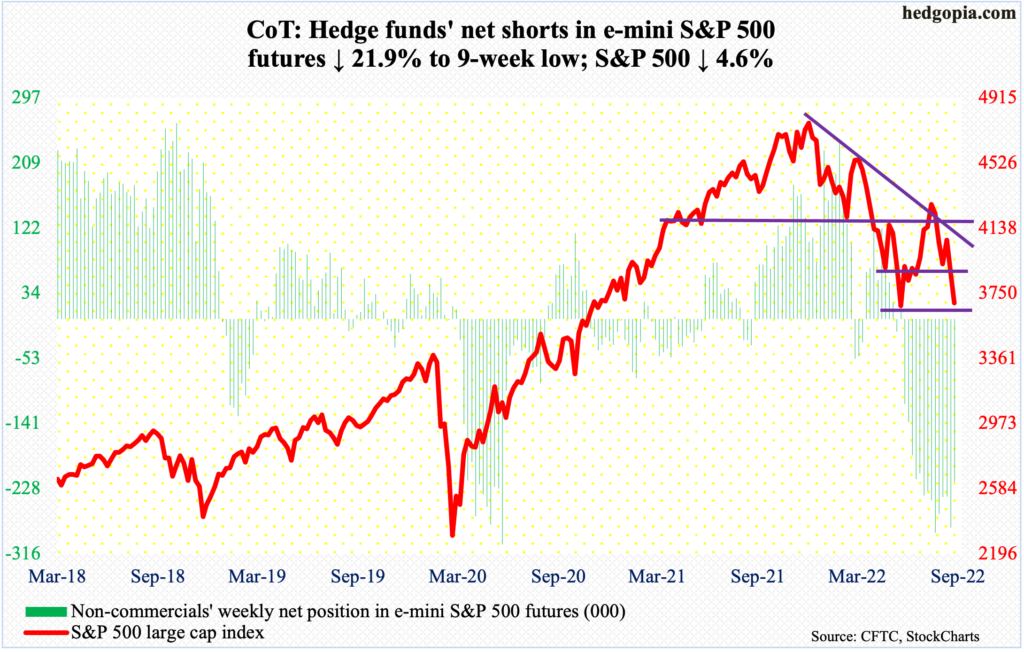
In the end, 3900 proved important. The level represents dual support – horizontal as well as a rising trend line from June 17 when the S&P 500 bottomed at 3637. Bulls lost it last Friday and went after it this week both Monday and Wednesday, with the latter – an FOMC decision day – tagging 3907 intraday but only to reverse hard to close at 3790. By Friday, the June low was just about tested, with the index touching 3647 and then rallying to close at 3693, still down 1.7 percent for the session.
A reflex rally is due. As things stand, bulls have a shot at 3900, and 4200 in best of circumstances, with the latter representing a falling trend line from January when the S&P 500 peaked at 4819.
Euro: Currently net long 33.4k, up 45.3k.

Just when it looked like euro bulls are putting their foot down around parity came Wednesday when the currency – in reaction to the FOMC decision and outlook – gapped down to tick $0.9813, followed by another gap-down on Friday ticking $0.9666 intraday and ending the week at $0.9693. The currency is at a two-decade low.
In the meantime, non-commercials switched to net long after being net short for 14 weeks in a row. Granted holdings are pre-FOMC decision, after which there were two gap-downs, this week’s bullish switch on the part of these traders could prove to be important in the fullness of time.
Immediately ahead, resistance lies at $0.9810s, followed by $0.9910s.
Gold: Currently net long 65.7k, down 31.6k.
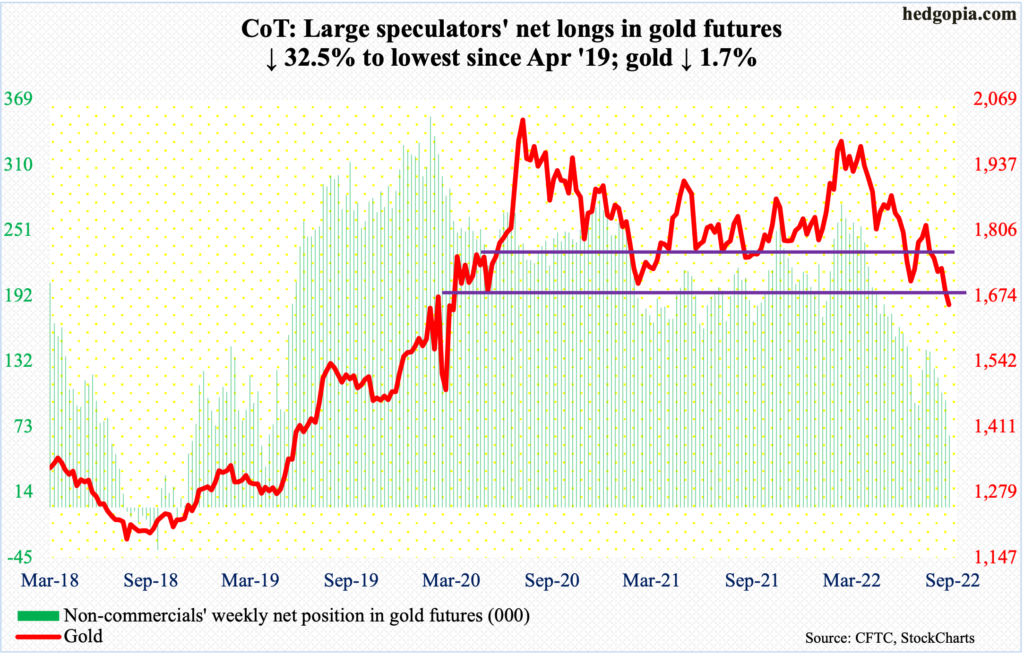
Thus far, gold bugs have succeeded in clinging on to horizontal support at $1,660s-$1,670s, which, going back to the early months of 2020, has been tested several times, including this July.
This was preceded by a breach of $1,760s-$1,770s toward the end of last month.
A loss of $1,660s-$1,670s at this point may open the door toward $1,560s. Worse, longer-term, there is dual support at $1,360s – horizontal going back to the latter months of 2010 and a rising trendline from December 2015 when gold bottomed at $1,045. The metal ended the week at $1,656/ounce.
Nasdaq 100 index (mini): Currently net long 3.5k, down 8.3k.
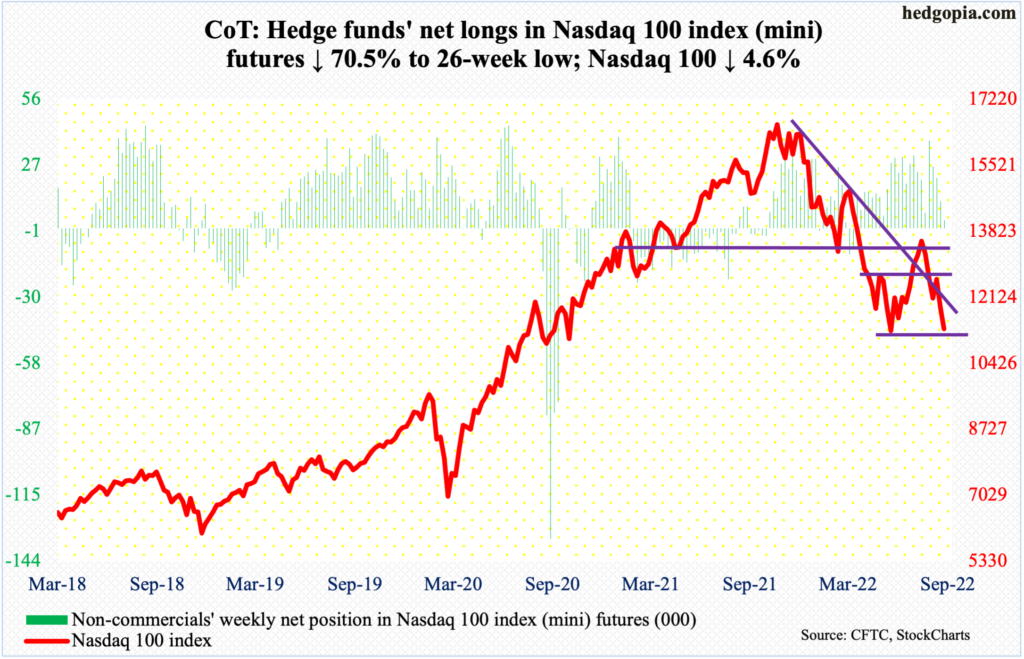
The Nasdaq 100 this week shed 4.6 percent. This was the fifth down week in the last six, with the sole up week two weeks ago overtaken by last week’s outside week, which often serves as part of a continuation pattern.
The daily remains grossly oversold, but if the weekly wins out, there is more room to go on the downside. From tech bulls’ perspective, the index (11311) troughed at 11037 on June 16, and this was just about tested on Friday with an intraday drop to 11170 – successfully.
Russell 2000 mini-index: Currently net short 106.8k, up 7.7k.

Small-cap bulls tried and succeeded in closing above 1800 just once – on Monday. As the week progressed, the Russell 2000 continued lower, touching 1659 intraday Friday and ending the week at 1680.
This represents a slight breach of 1700, which between mid-June and mid-July, was defended several times, with the index touching 1641 on June 16, which remains intact. By the way, 1700 is where the small cap index broke out of in November 2020.
The index has played ranges for a while now.
A major breakdown occurred mid-January this year, losing 2080s; for 10 months before that, the Russell 2000 played ping pong between 2080s and 2350s, followed by a seesaw action between 2080s and 1900 and between 1900 and 1700 after that.
Should 1700 hold – it likely will – 1800, and 1900 after that, are the levels to watch.
US Dollar Index: Currently net long 27.9k, down 7.7k.
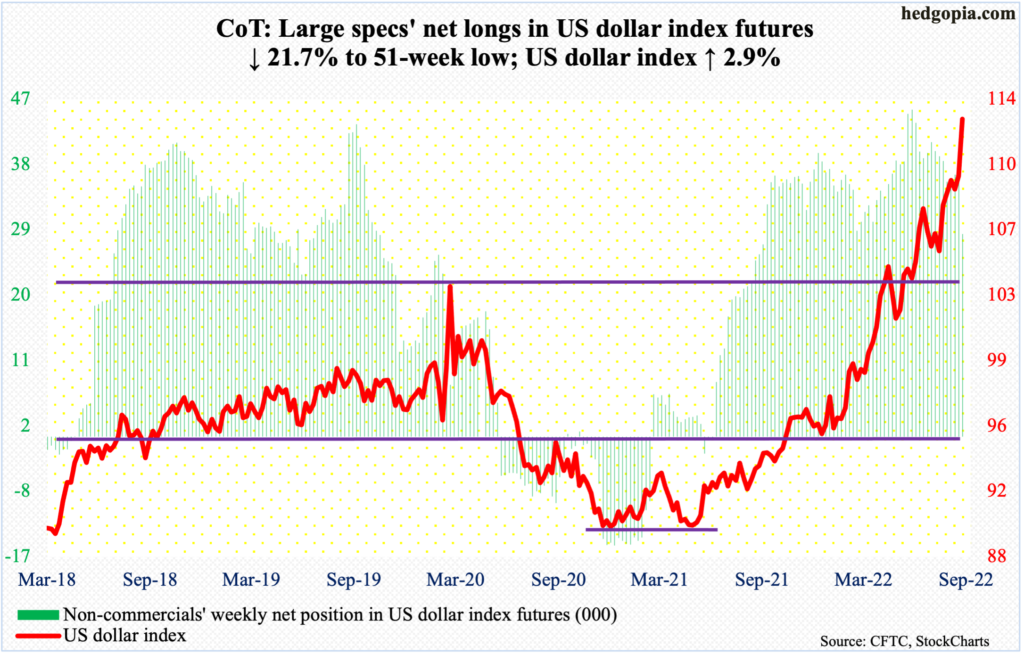
The US dollar index bottomed at 89.52 in May last year. Intraday Friday, it tagged 113, closing at 112.96. Along the way, it has had several important breakouts.
Early this month, it witnessed a mini-break out of 109.10s, which was defended both Monday and Tuesday. If and when this support gives way, 104 is the next level to watch, with a lot more significance; the index broke out of this level in June.
VIX: Currently net short 81.8k, down 16.7k.
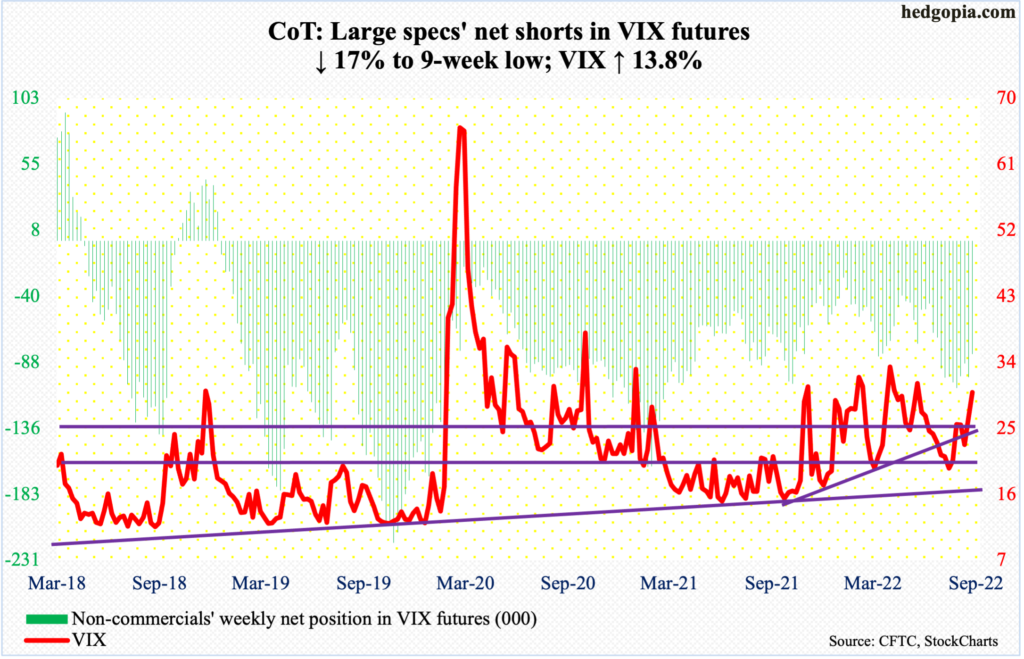
VIX had been denied at 27.60s since late August (more on this here). This week, the volatility index went through a very volatile, long-legged doji session on Wednesday, with a high of 30.18 and a low of 25.55, closing at 27.99.
Come Friday, the resistance in question was comfortably taken out; still, volatility bulls would probably hope the session ended strong, with VIX rallying as high as 32.31 but closing at 29.92, leaving behind a long upper wick. This has the potential to be a spike reversal. Next week is key.
Thanks for reading!
