
Following futures positions of non-commercials are as of October 18, 2022.
10-year note: Currently net short 313.4k, down 26.7k.
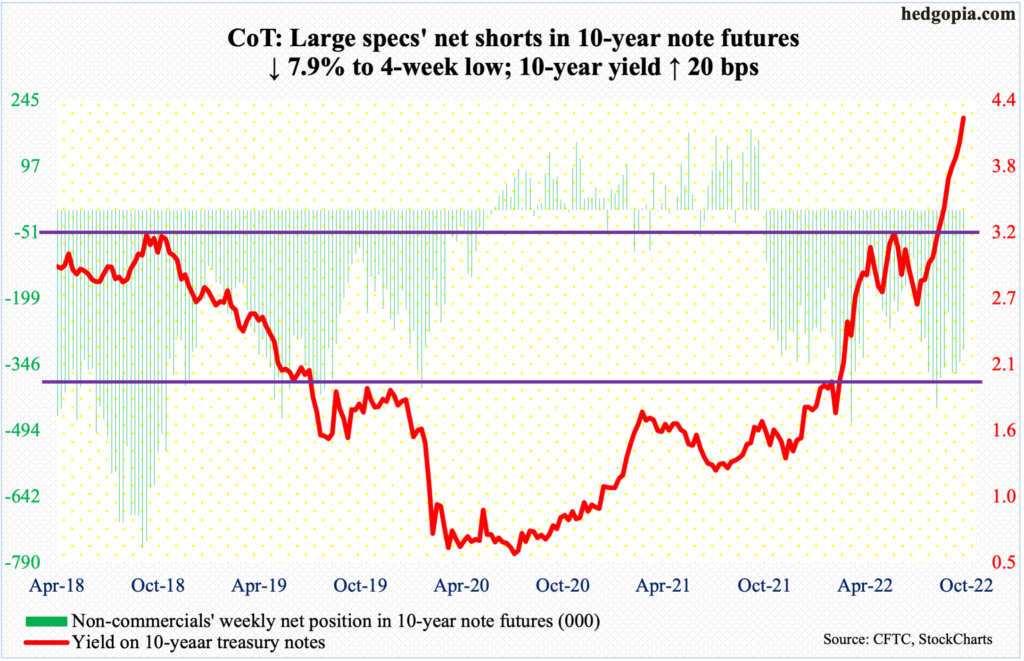
Relentless is the word that comes to mind the way the 10-year treasury yield has rallied the last 12 weeks. On August 2, rates touched 2.53 percent intraday. This week, the 10-year tagged 4.33 percent intraday Friday before reversing lower to end the week at 4.21 percent – still up 20 basis points for the week. With this, rates broke out of 4.1 percent, which has been an important level going back 24 years.
Needless to say, several technical indicators are extremely overbought. The RSI closed Friday at 79.4 on the monthly, 78.8 on the weekly and 73.7 on the daily. This in and of itself does not mean a reversal has to happen right away. Upward momentum is intact, and traders see this. Friday’s intraday reversal in this regard could be the beginning of something – or not. This week’s breakout point – 4.1 percent – therefore has significance (more on this here).
If the breakout is genuine, then bond bears (on price, which has an inverse relationship with yields) should use the level as a buying opportunity. Non-commercials, which in recent weeks have slightly reduced net shorts in 10-year note futures, still hold north of 300,000 contracts. These traders rode the most recent rally in yields perfectly, so their action is worth a watch.
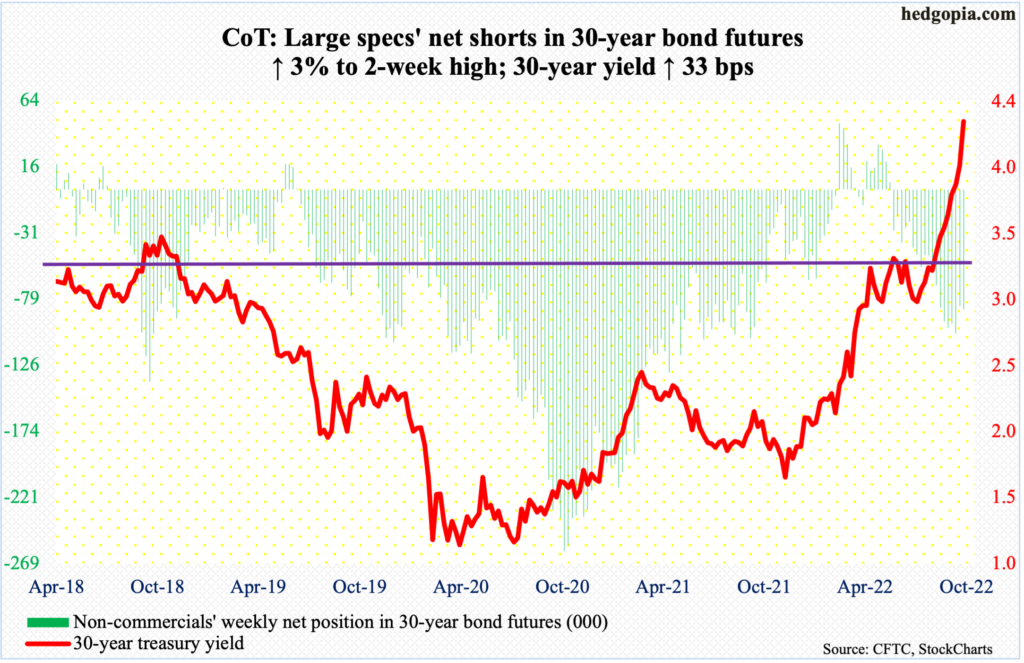
30-year bond: Currently net short 86.3k, up 2.5k.
Major economic releases for next week are as follows.
The S&P Case-Shiller home price index (August) is scheduled for Tuesday. Nationally, US home prices increased 15.8 percent year-over-year in July – elevated but slower than the record appreciation of 20.8 percent in March.
On Wednesday, new home sales (September) are due out. In August, sales shot up 28.8 percent m/m to a seasonally adjusted annual rate of 685,000 units. July’s 532,000 matched March 2016 sales.
GDP (3Q22, first print) and durable goods orders (September) are on tap for Thursday.
Real GDP shrank 0.6 percent in 2Q, which is the second consecutive contraction after 1Q’s 1.6-percent decline. The Atlanta Fed’s GDPNow model forecasts growth of 2.9 percent in 3Q.
August orders for non-defense capital goods ex-aircraft – proxy for business capex plans – increased 1.4 percent m/m to $75.7 billion (SAAR) – a new record.
Friday brings the employment cost index (3Q22), personal income/spending (September) and the University of Michigan’s consumer sentiment index (October, final).
In 2Q, private-industry total comp jumped 5.5 percent y/y, which is the sharpest pace since 2Q84.
In the 12 months to August, headline and core PCE (personal consumption expenditures) jumped 6.2 percent and 4.9 percent respectively, having peaked at seven percent and 5.4 percent in June and February, in that order.
October’s preliminary reading showed consumer sentiment rose 1.2 points m/m to 59.8 – a six-month high.
WTI crude oil: Currently net long 255.6k, down 20.4k.
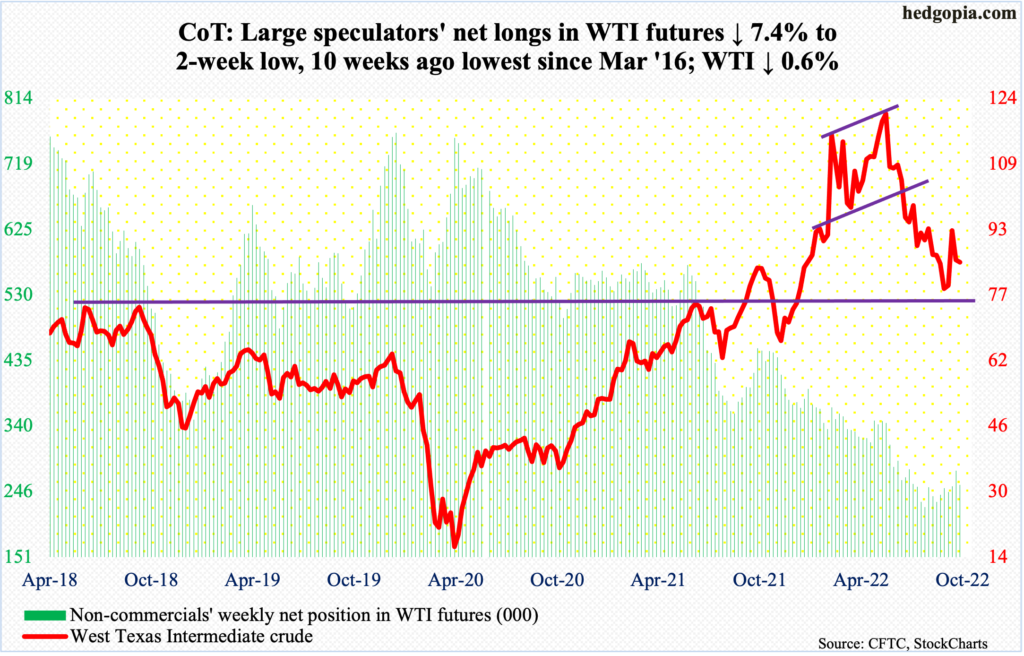
President Joe Biden has already ordered the release of 165 million barrels of the planned 180 million barrels of crude oil from the Strategic Petroleum Reserve this year. The release of up to 15 million barrels was announced this week. The administration also said that it will replenish the reserve, which has dropped from 593.7 million barrels at the end of last year to 405.1 million barrels, by buying when the price falls between $67 and $72 a barrel. Traders will now treat this as a floor and will start buying before the price even gets there. That said, it is hard to imagine OPEC+ letting the price fall that low. The group just agreed to an output cut of two million barrels per day to stop the recent decline in price.
WTI dropped to $76.25 on September 26, having earlier ticked $130.50 in March and $123.68 in June. The subsequent rally stopped last week at horizontal resistance at $93-$94; this week, the 50-day ($86.80) acted as a repellent on Thursday.
At the same time, oil bulls have managed to defend lateral support at $85. Until a break occurs one way or the other, WTI could very well be rangebound between $93-$94 and $85, with breakdown risks rising at some point given the probability of a US recession next year. The crude closed out the week at $85.05/barrel.
In the meantime, per the EIA, US crude production in the week to October 14 increased 100,000 barrels per day to 12 million b/d. Crude imports, on the other hand, decreased 155,000 b/d to 5.9 mb/d. As did stocks of crude and gasoline, which respectively dropped 1.7 million barrels and 114,000 barrels to 437.4 million barrels and 209.4 million barrels. Distillate stocks rose 124,000 barrels to 106.2 million barrels. Refinery utilization dropped four-tenths of a percentage point to 89.5 percent.
E-mini S&P 500: Currently net short 223.2k, up 59.1k.
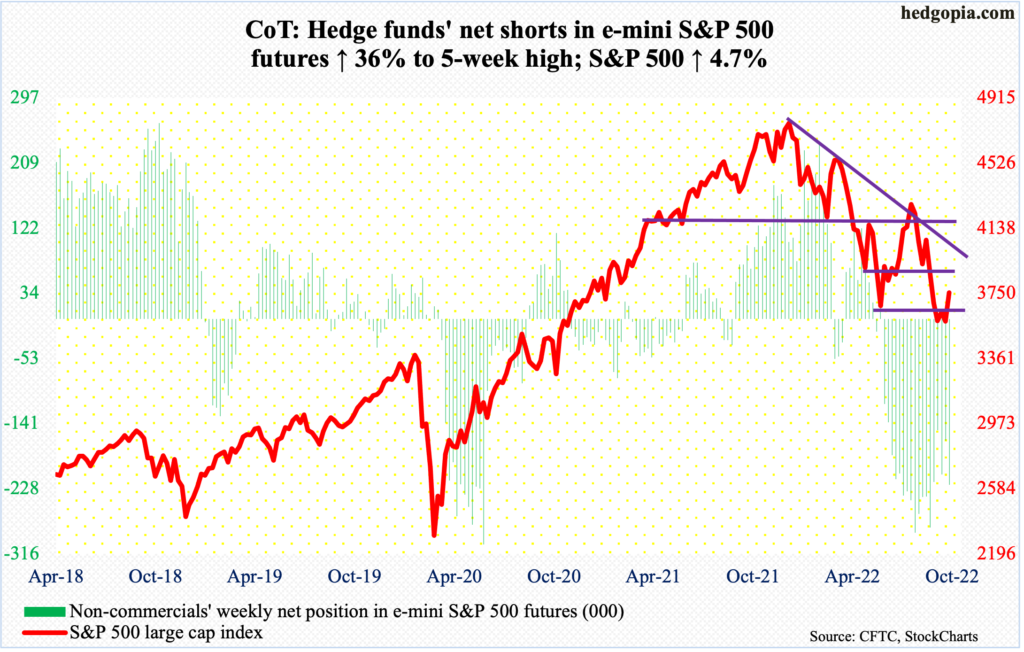
For the first time in two months, flows into US equity funds in the week to Wednesday were positive at $4.1 billion (courtesy of Lipper). In the prior eight, $58.7 billion was redeemed. In the same week, SPY (SPDR S&P 500 ETF), VOO (Vanguard S&P 500 ETF) and IVV (iShares Core S&P 500 ETF) combined took in $6.6 billion, but these ETFs have seen inflows for five weeks now, for a total $22.4 billion (courtesy of ETF.com).
The S&P 500 jumped 4.7 percent for the week to 3753. From the low of 3492 on the 13th, the large cap index is now up 7.5 percent. Friday’s 2.4-percent rally was launched just above 3630s support, which was the low in June. Immediately ahead, it has room to rally to 3870s, which is also about where the falling 50-day (3887) lies.
Euro: Currently net long 48.1k, up 10.7k.
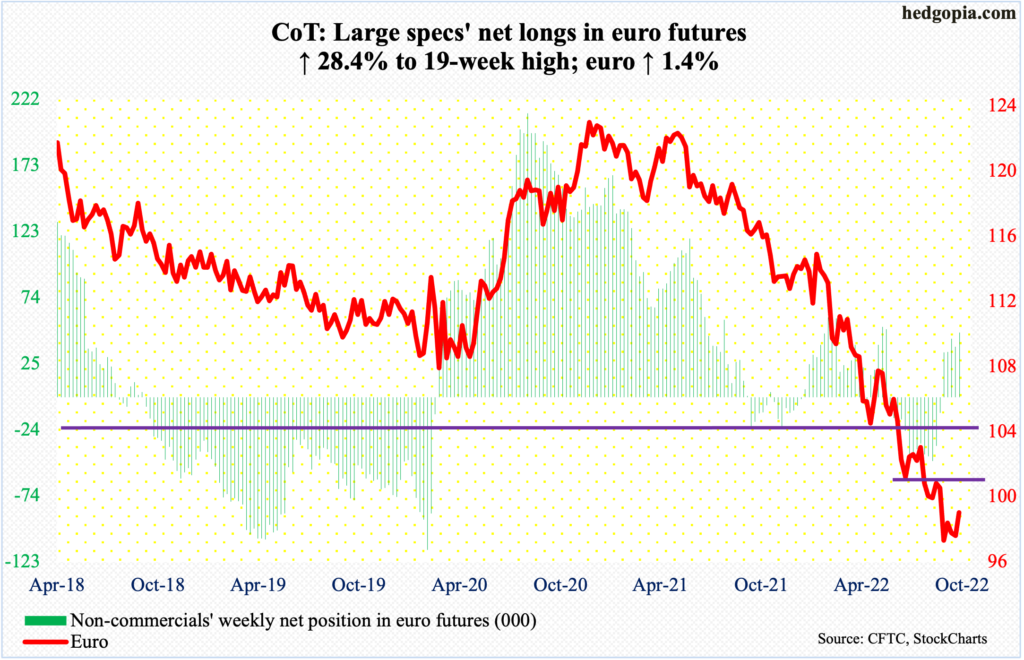
The euro ($0.9862) rose 1.4 percent this week. This came on the heels of a spinning top last week and a shooting star before that.
The constructive action in recent weeks preceded a 21-month collapse, peaking at $1.2345 in January last year and bottoming last month at $0.9559, which was the lowest since June 2002. That low has the potential to be an important low.
Immediately ahead, there is horizontal resistance at $0.9910s, which is where the 50-day lies. Then comes the all-important $1.04, which was lost in July.
Gold: Currently net long 77k, down 17.5k.
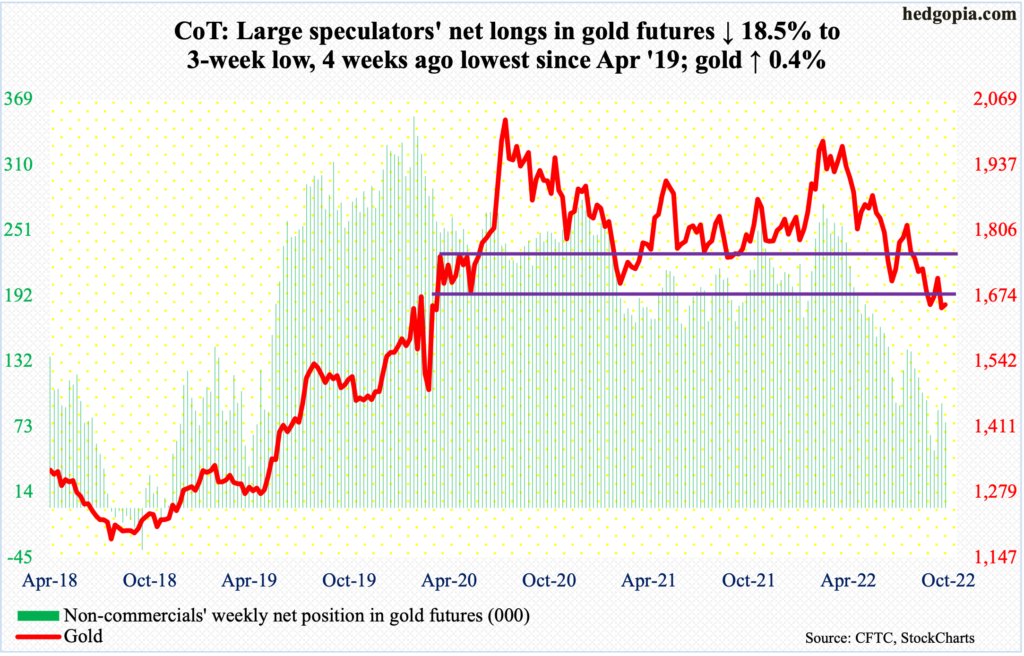
Last week, gold ($1,656/ounce) slightly breached crucial $1,660s-$1,670s. This week, the metal went at it again, ticking $1,674 intraday Monday before weakening. By Thursday, it tagged $1,626, essentially testing the September 22 low of $1,622, a decisive breach of which exposes gold to a test of $1,560s.
Worse, longer-term, there is dual support at $1,360s – horizontal going back to the latter months of 2010 and a rising trendline from December 2015 when gold bottomed at $1,045.
Nasdaq 100 index (mini): Currently net long 1.5k, down 7k.
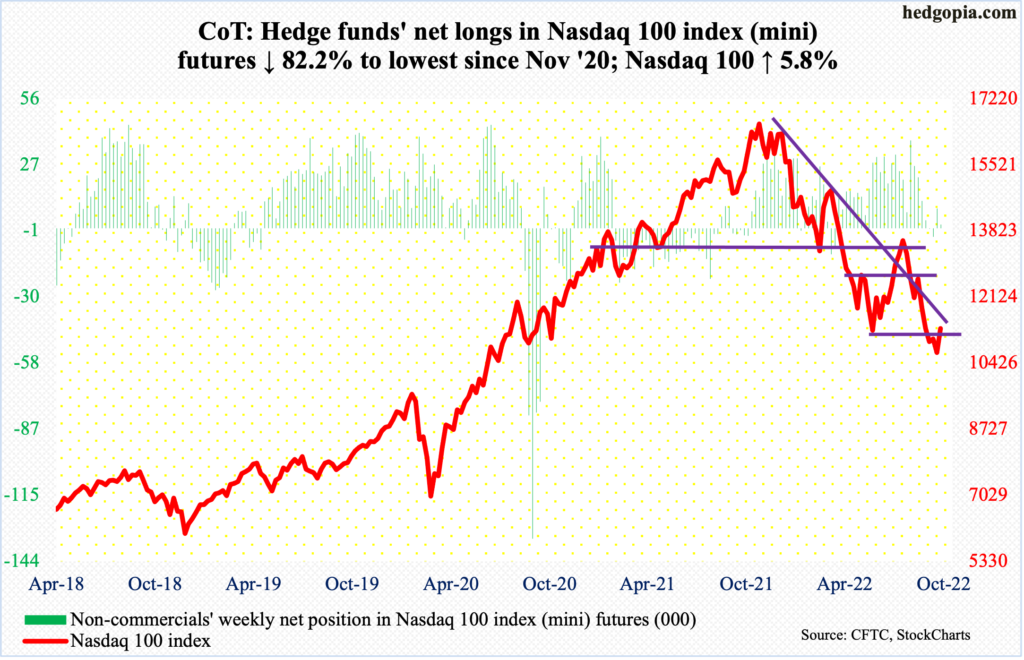
Tech bulls recaptured the June low this week, with the Nasdaq 100 jumping 5.8 percent. They are loading up as the major US tech companies get ready to report their 3Q (more on this here). Rightly or wrongly, some are probably bargain-hunting. From the peak last November through the low on the 13th (this month), the index plunged 37.7 percent.
Right here and now, the index (11310) has room to rally toward 12000. The 50-day lies at 11962.
Russell 2000 mini-index: Currently net short 79.8k, down 5.8k.
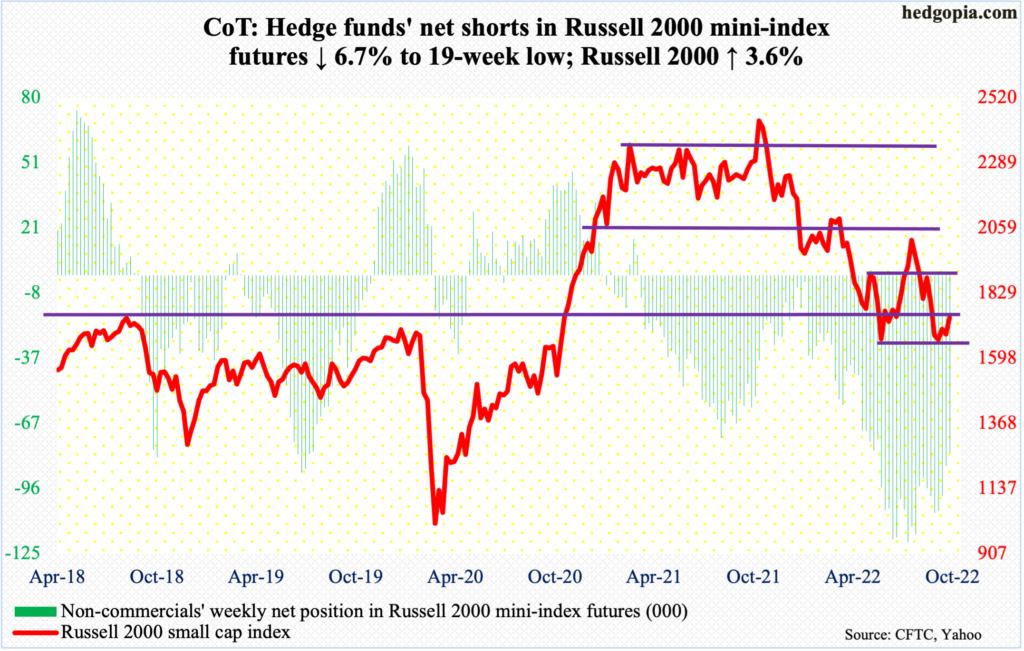
Unlike their large-cap peers, small-cap bulls did a great job in defending the June low on the Russell 2000 but rallies off of that low have come up short.
This week, the index rose 3.6 percent – much softer than what the S&P 500 and Nasdaq 100 put together. On Tuesday, the Russell 2000 retreated after touching 1780s, which for five months now has been used by both the bulls and bears as support and resistance.
A takeout of 1780s opens the door to 1900, which is the top end of a months-long range. The index ended the week at 1742.
US Dollar Index: Currently net long 32.7k, down 96.
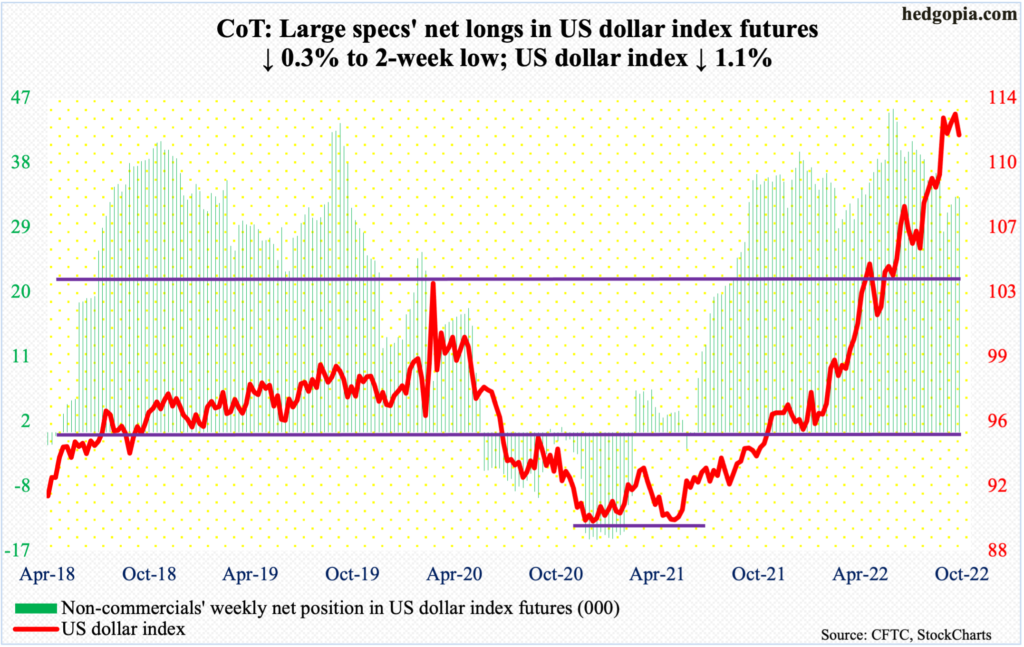
On September 28, the US dollar index touched 114.75 – the highest print since May 2002 – before retreating, with the corresponding week forming a candle with a long upper wick. This was then followed by a weekly hanging man, a spinning top and a wide-ranging red candle this week.
In yet another sign the index may very well be going through some kind of distribution, it was down 1.1 percent this week – unable to follow the rally in long-term rates higher; the 10-year treasury yield jumped 20 basis points this week.
In the event of downward pressure, nearest support lies at 109.10s, followed by the all-important 104. The index ended the week at 111.98.
VIX: Currently net short 60.8k, down 13.3k.
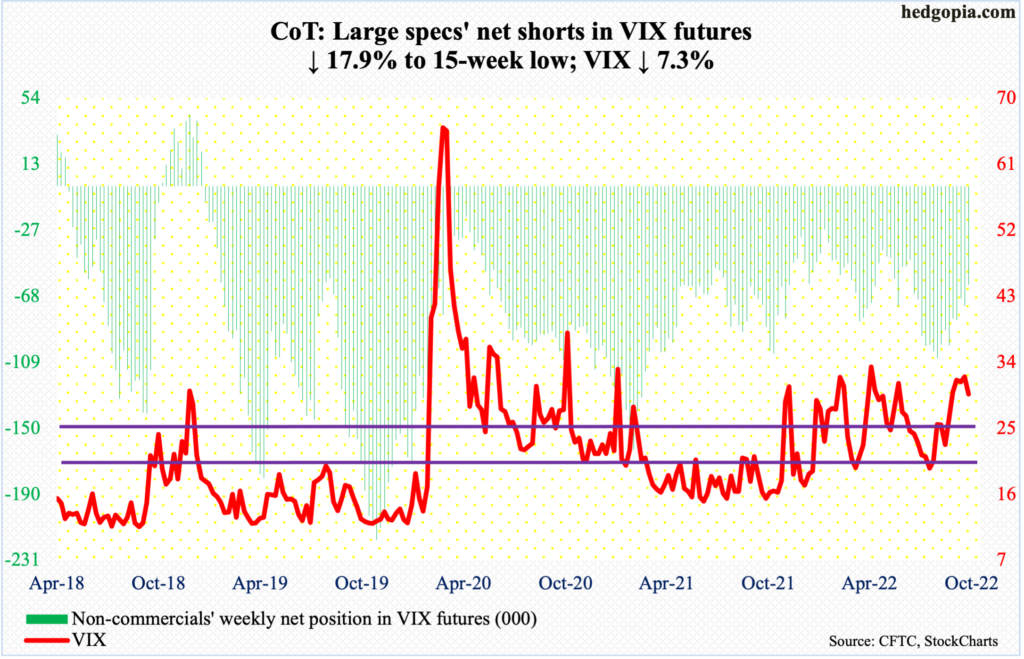
VIX could very well be itching to go lower, particularly if the weekly takes over.
Last week, two of the five daily candles were spinning tops, one with a long upper wick, one a long-legged doji and one a large red candle. This week, the volatility index fell in four of the five sessions, to 29.69.
Ahead, a test of mid-20s looks imminent; both the 50- and 200-day lie around there (27.13 and 26.32 respectively). If that gives way, then the next layer of support lies at low-20s.
Thanks for reading!
