
Following futures positions of non-commercials are as of November 22, 2022.
10-year note: Currently net short 321.3k, down 21.8k.
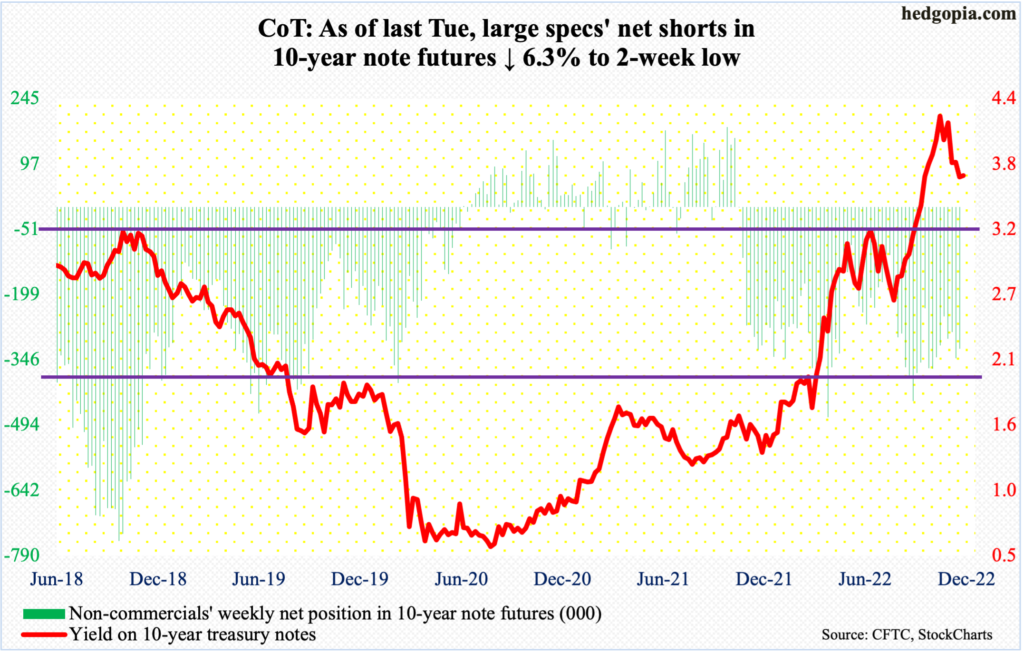
Markets and FOMC hawks are on diverging paths.
In the futures market, traders expect the fed funds rate to peak just north of five percent next May, go sideways for a few months and then go the other way by September, ending 2023 between 450 basis points and 475 basis points.
The benchmark rates are currently in a range of 375 basis points to 400 basis points, up from zero to 25 basis points in March this year. The FOMC meets next month (14-15) and is expected to raise by 50 basis points. Until October’s softer-than-expected CPI, which was reported on the 10th this month, traders were not sure if the Fed would hike by 75 or 50 next month.
Trader sentiment has changed – to the extent that they now expect the Fed to begin to lower rates in the latter months of 2023. That is not the message coming from FOMC members – the hawks in particular.
Just yesterday, James Bullard, president of the St. Louis Fed, said the Fed could slowly raise rates to a range of five percent to seven percent. “I think we’ll probably have to stay there all during 2023 and into 2024.”
Also yesterday, John Williams, New York Fed president, said “inflation is far too high.”
If Bullard is right, then the markets are clearly underestimating the extent to which the Fed will remain restrictive. He is a voting member now but not next year, while the New York Fed has a permanent voting seat.
Markets, on the other hand, are more in line with Vice-Chair Lael Brainard who cautions her colleagues not to overdo it. Ordinarily, markets tend to lead the Fed. This time around, the dynamics are different. Chair Jerome Powell – a hawk – is not going to risk his legacy by letting inflation remain elevated in order to save jobs.
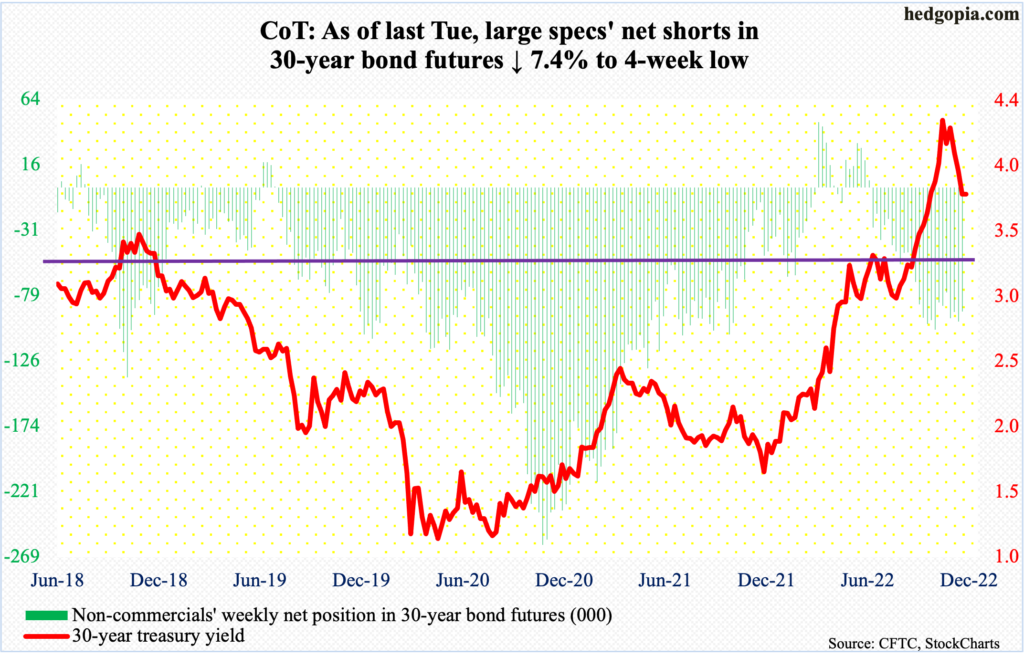
30-year bond: Currently net short 90.5k, down 7.2k.
Major economic releases for this week are as follows.
The S&P Case-Shiller home price index (September) is due out later this morning. In August, home prices nationally increased 13 percent year-over-year, which is slower than the record pace of 20.8 percent in March but represents a phenomenal rate of growth.
On Wednesday, GDP (3Q22, second print) and job openings (JOLTs, October) are reported.
The first estimate showed real GDP grew 2.6 percent in the third quarter. This follows back-to-back negative quarters. The economy shrank 1.6 percent in 1Q and 0.6 percent in 2Q.
Non-farm job openings in September grew 437,000 month-over-month to 10.7 million. The series peaked in March at 11.9 million.
Personal income/spending (October) and the ISM manufacturing index (November) are on deck for Thursday.
In the 12 months to September, the PCE price index grew 6.2 percent on a headline basis and 5.1 percent on core.
In October, manufacturing activity fell seven-tenths of a percentage point m/m to 50.2 percent.
Payrolls (November) come out on Friday. Job growth has decelerated in recent months but remains decent. In the first 10 months, non-farm employment increased at a monthly average of 407,000, which is way softer than last year’s monthly average of 562,000.
WTI crude oil: Currently net long 292.1k, down 15.5k.
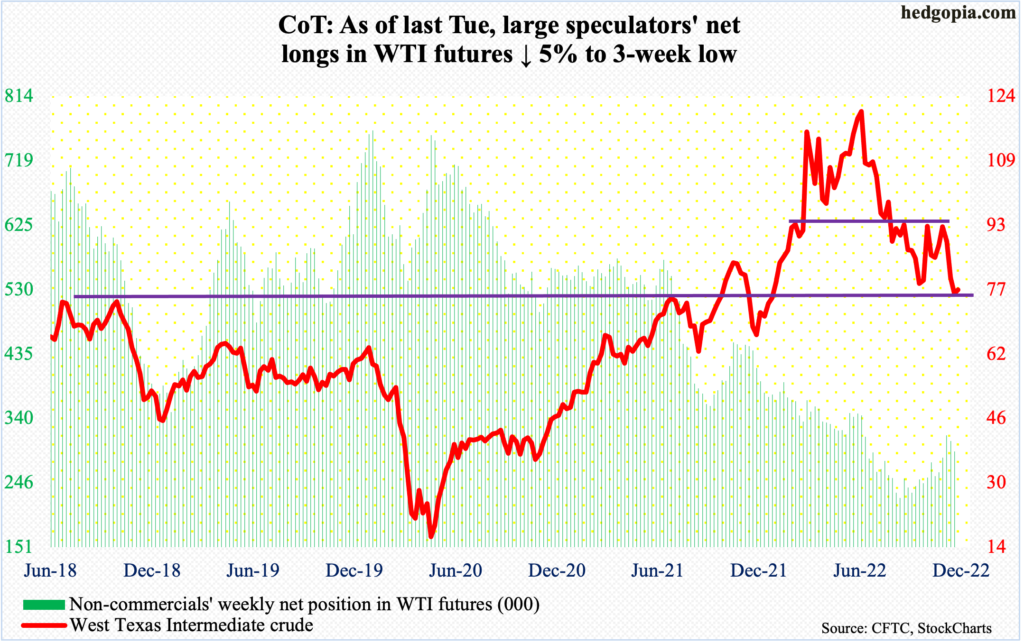
Earlier this month, oil bulls were strongly rejected at $93-$94, which goes back to at least January this year. The subsequent drop took WTI ($77.24/barrel) all the way to Monday’s intraday low of $73.60, which breached lateral support at $75-$76 intraday but was saved by close.
Assuming the crude remains above $75-$76, it should be fine. The daily is oversold, and a rally can ensue. Straight-line resistance at $85 coincides with the 50-day moving average.
E-mini S&P 500: Currently net short 191.5k, down 11.2k.
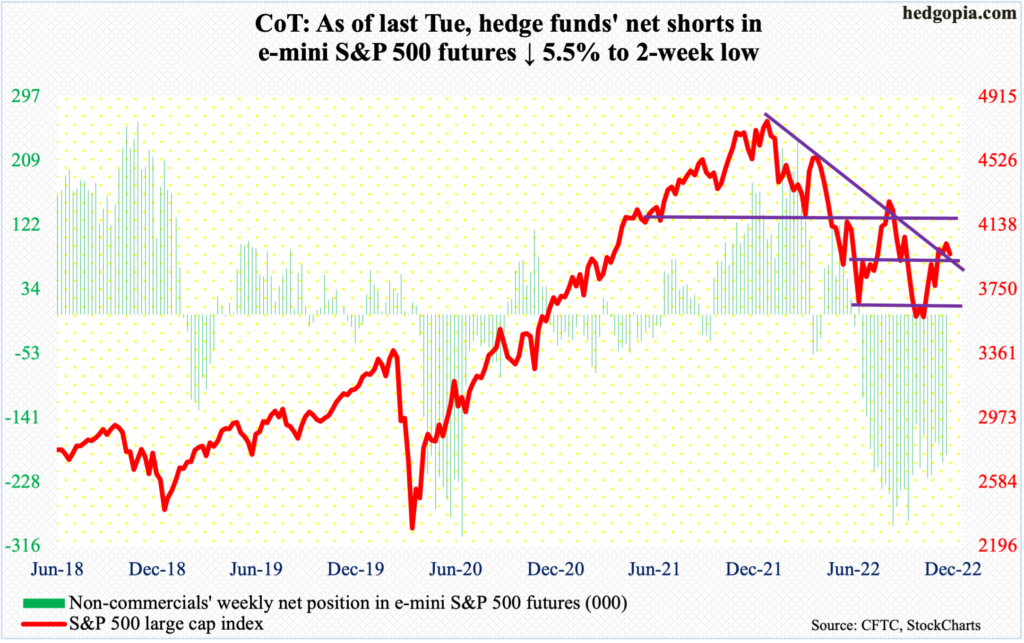
From the October 13 low of 3492 through last Friday’s high of 4034, the S&P 500 rallied just north of 15 percent. This was preceded by a 27.5-percent decline from January’s record high 4819.
After the six-week rally, the large cap index was in need of a breather. Sellers showed up at dual resistance. Last Friday’s high was within an earshot of the 200-day (4054); just above also lies trend-line resistance from January.
The daily is looking for a reason to head lower. The path of least resistance is toward 3900.
Euro: Currently net long 123.1k, up 10.4k.
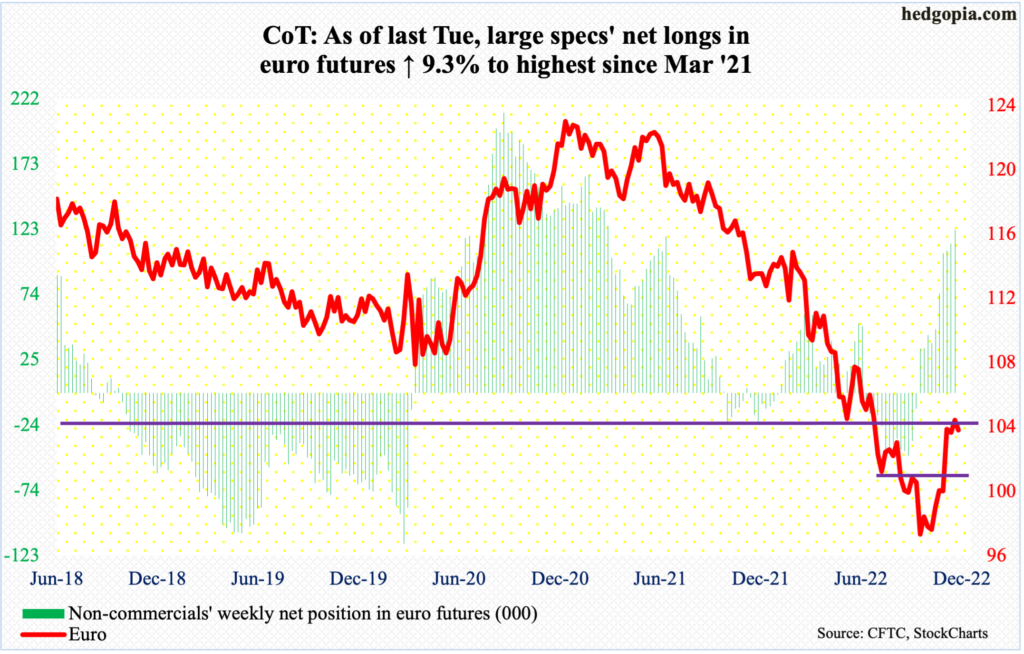
On the 15th, the euro tagged $1.0482 intraday before retreating. Prior to this, the currency had bottomed at $0.9559 on September 28. Even earlier in January last year, it peaked at $1.2345.
This Monday, euro bulls had another opportunity to reclaim $1.04 but were bombarded by selling pressure, ticking $1.0478 intraday and closing the session at $1.0340. This was also a failed attempt at the 200-day ($1.0411).
The daily wants to go lower.
Gold: Currently net long 116.1k, down 10.2k.
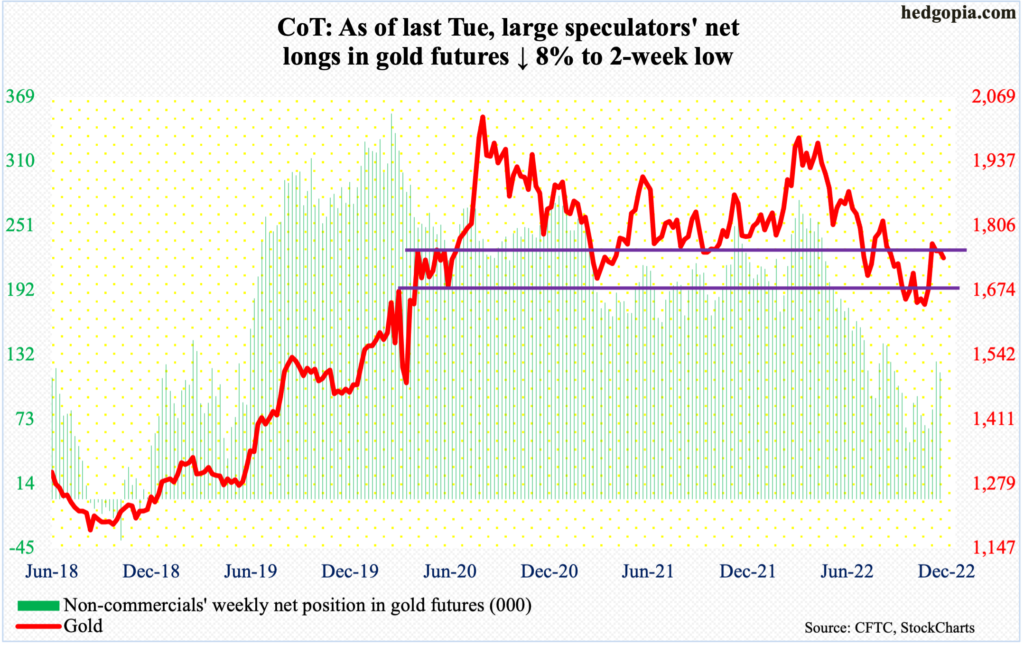
On the 15th (this month), gold ($1,740/ounce) slightly reversed after touching $1,792 intraday. If it held, the metal would have reclaimed $1,760s-$1,770s. Gold bugs will have to wait for that.
Failure at $1,760s-$1,770s opens the door toward $1,660s-$1,670s. The 50-day at $1,692 lies before that.
Nasdaq 100 index (mini): Currently net long 3k, up 8.3k.
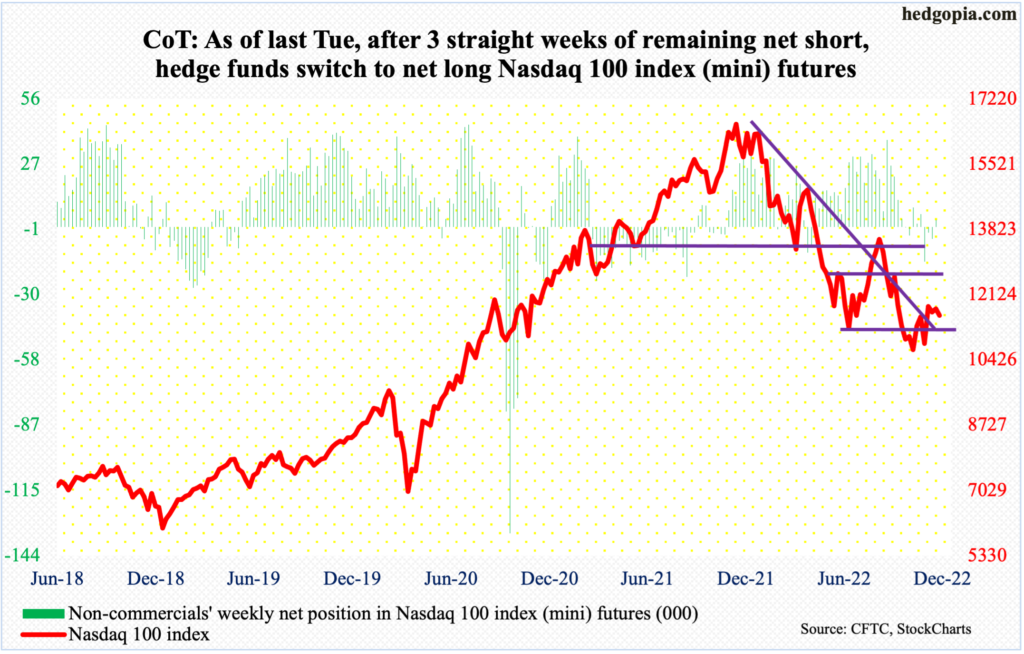
The Nasdaq 100 had a flattish look the last couple of weeks. The tech-heavy index rallied from 10441 on October 13 to 12025 on the 15th this month.
After several sessions of sideways action, the index sort of cracked this Monday, losing the 10-day. On the weekly, several indicators including the RSI and stochastics are turning lower from the median.
The daily is overbought. The 50-day lies at 11339, which will be a first test of the bulls’ mettle. The index ended Monday at 11588.
Russell 2000 mini-index: Currently net short 64.9k, down 3k.
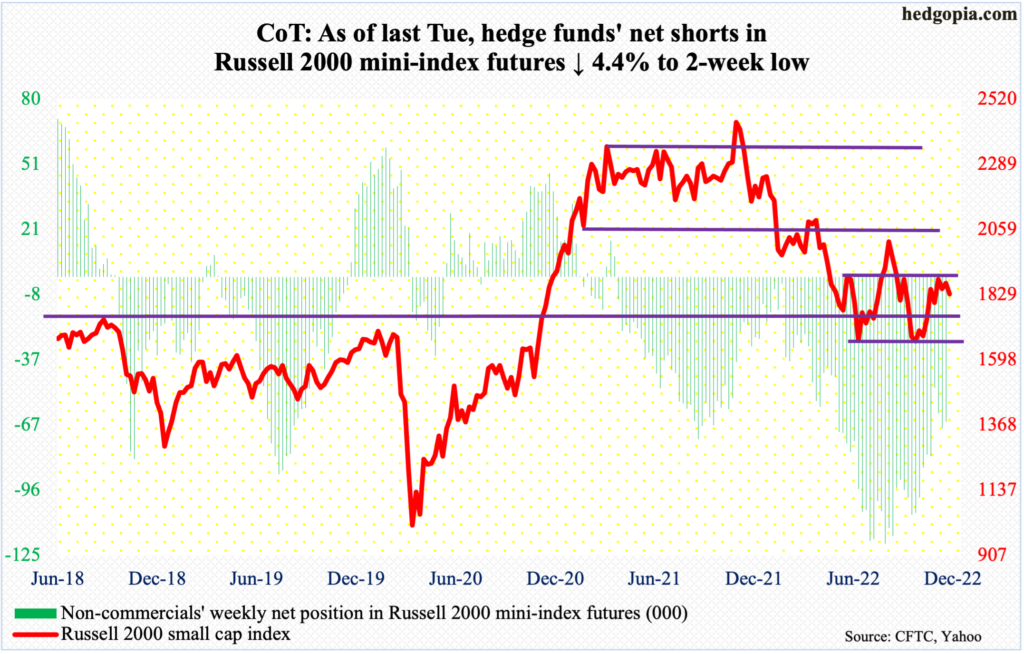
The Russell 2000 peaked last November at 2459 and then dropped all the way to 1642 by October 13 this year. Along the way, a major breakdown occurred mid-January, losing 2080s; for 10 months leading up to that, the small cap index went back and forth between 2080s and 2350s. It then seesawed between 2080s and 1900, followed by a ping pong match between 1900 and 1700; 1700 is where it broke out of in November 2020.
The rally post-October 13 low culminated in an unsuccessful test of 1900 on the 15th this month, with the index tagging 1905 intraday but ending with a shooting star. After that, several other attempts to charge toward that resistance got stopped midway. Last Friday, 1874 was reached intraday.
The way things are shaping up, the odds of 1800 are much better than a break past 1900.
US Dollar Index: Currently net long 24.1k, down 2.8k.
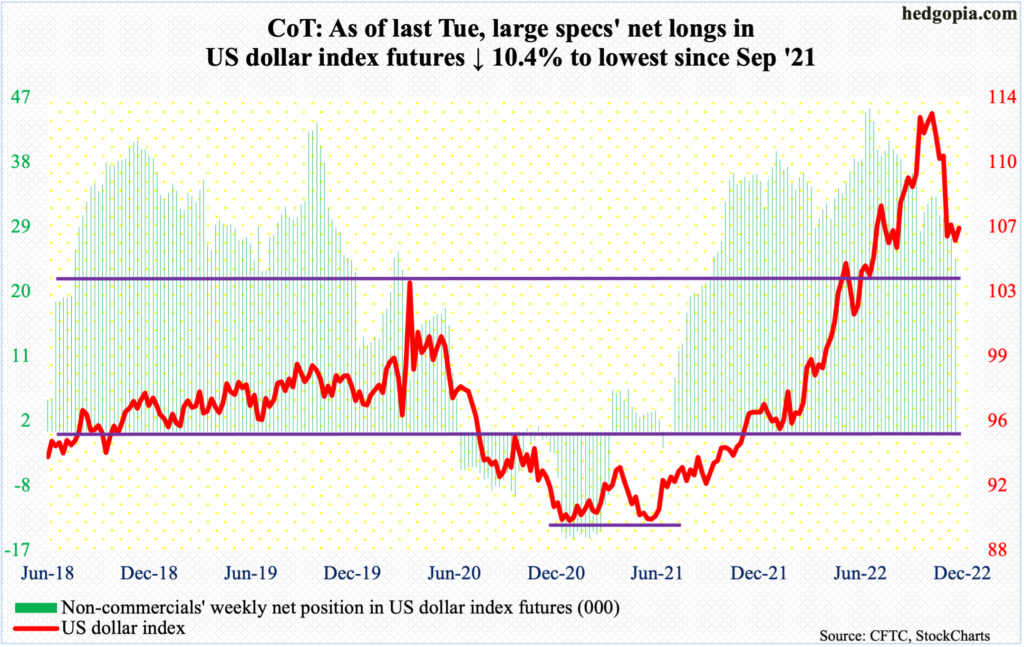
On September 28, the US dollar index reached a major high tagging 114.75 – the highest print since May 2002. After several lower highs, it tagged 105.16 on the 15th this month. That low was tested again this Monday with an intraday print of 105.25, closing at 106.63; the hammer reversal showed up just above the 200-day at 105.06.
For now, the index wants to go higher. There is decent resistance at 109.
VIX: Currently net short 63.3k, down 1.5k.
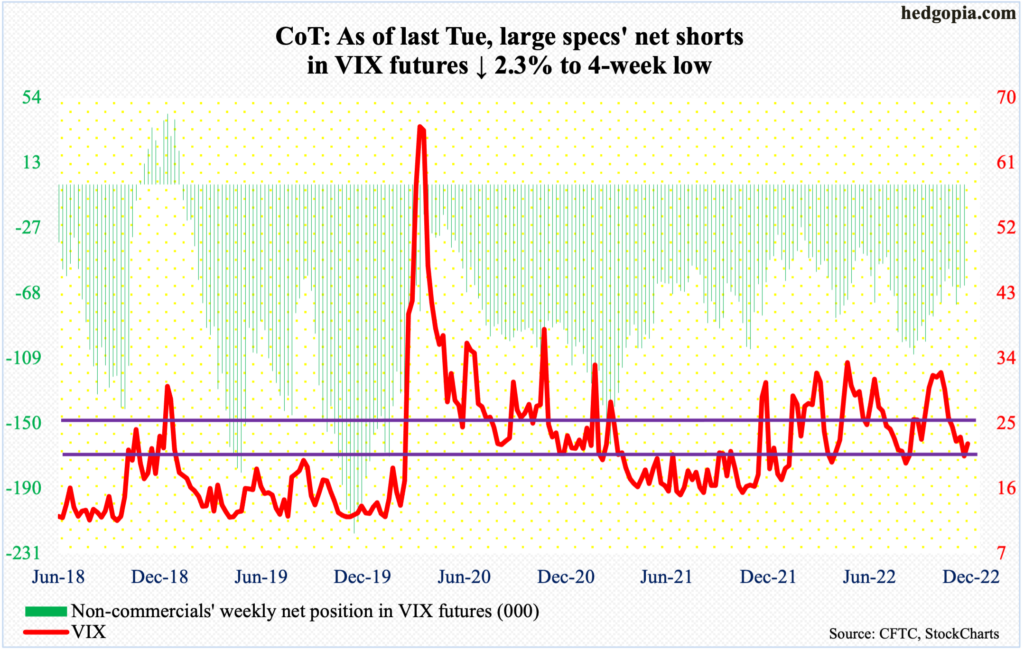
Volatility bulls defended low-20s.
Last Friday, VIX closed at 20.50. Come Monday, the index gapped up to rally 1.71 points to 22.21.
The daily is itching to rally. Nearest resistance rests at mid-20s, with moving-average resistance around there or just above. The 50- and 200-day lie at 27.53 and 26.44 respectively.
Thanks for reading!
